
One of the most “dynamically growing” areas of dishonest publishers’ activity is manipulation aimed at advertisers in mobile apps.
The article on ad fraud in performance marketing describes other techniques used to extract budgets from online advertisers.
All over the world, millions of users uncritically install all kinds of apps, often without wondering who created them, why, and why they are free. Very often such an app will not harm the user (apart from consuming extra device resources), and its purpose will be to generate clicks.
The case study described in this article is based on an advertiser’s data, modified for the purposes of this article to ensure data confidentiality – with no impact on the substance. Selected aspects of the analysis are shown for clarity.
What the KPIs show
Our example e-commerce advertiser, running campaigns promoting a mobile app, uses KPIs in the form of cost per install (CPI) and return on investment measured by the value of in-app purchases (ROI). To promote the app, it uses Google and Facebook advertising systems as well as several other ad networks.
| Source | Clicks | Installs | Conv. rate |
Cost | Revenue | ROI | CPI |
|---|---|---|---|---|---|---|---|
| Network A | 14.2M | 83K | 0.58% | $7.3K | $14.4K | 95% | $0.09 |
| (organic) | N/A | 67K | N/A | N/A | $99K | N/A | N/A |
| Network B | 8.7M | 41K | 0.48% | $16.5K | $31K | 88% | $0.40 |
| Facebook Ads | 522K | 21K | 4.14% | $29K | $17.1K | -41% | $1.34 |
| Google Ads | 379K | 17K | 4.39% | $38.6K | $21.2K | -45% | $2.32 |
| Landing Page | 22K | 4.8K | 21.89% | N/A | $8.2K | N/A | N/A |
| Network C | 3.6M | 9.8K | 0.27% | $4.9K | $8.5K | 73% | $0.50 |
In the report we can see that networks A, B and C have very low conversion rates compared to Google and Facebook, while their CPI and ROI look great thanks to a very low cost per click. This is the first warning sign, because cheap, low-quality traffic may come from spam.
CTIT – Click to Install Time
To better understand the nature of the traffic delivered by each source, you need to take a closer look at their statistics. Any deviation from the norm will be a signal that something may not be what it seems.
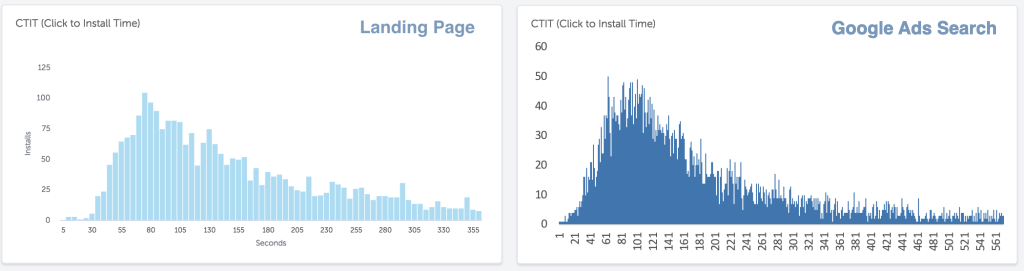
But what is the norm? We should assume that normal behaviour comes from users where there is no risk of manipulation by the ad publisher. An example of such traffic are users coming from the advertiser’s own landing page promoting the app. We can also assume that ad clicks in Google Search will represent “natural” users.
The first parameter to analyse is the time between click and install (CTIT). Natural users usually need about 30-120 seconds to complete the installation and open the downloaded app. It can hardly be done faster. Here is what this parameter looked like for the landing page and Google Search ads:
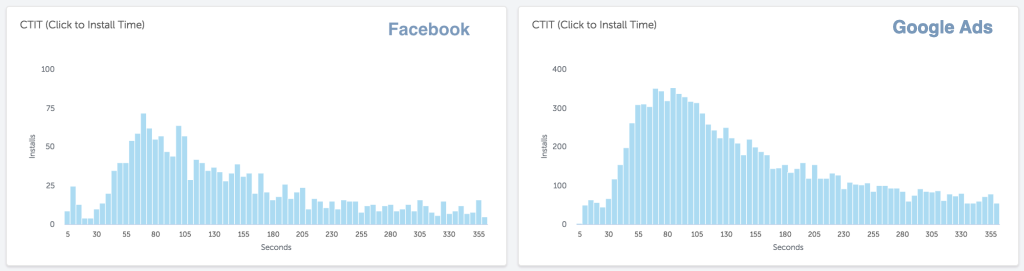
CTIT in Google Ads and Facebook has a similar distribution. In the case of Facebook, however, we observe a certain number of very fast downloads:
In networks A and B, the profile of user behaviour is completely different. Installs completed within a few seconds dominate over normal user behaviour:

The CTIT distribution chart for network C looked similar. So we can see that for installs attributed to Facebook and Google Ads, the traffic is close to normal. In networks A, B and C we are dealing with a larger number of misattributed installs, because downloading an app in such a short time is simply not possible.
It is worth noting that the tool used here, AppsFlyer, reports an install through the first app open event. It may therefore happen that a conversion is attributed to an app that had already been downloaded but had not been opened before.
Despite the large numbers visible on the charts, installs with suspiciously short CTIT constitute a small part of all installs, so eliminating them does not significantly change the picture of ad profitability in networks A, B, C.
Installs vs. active users and revenue per user
Important indicators for detecting irregularities are user quality measures, such as the percentage of engaged users and revenue per user. Let’s see what this looks like in our case:

We can see that revenue per active user (ARPU) is similar across all ad networks. We observe higher ARPU in organic sources and the landing page, which can be explained by a higher share of loyal customers installing the app. Network A has a small percentage of active users, which points to fake or forced installs.
Conversion path analysis
To understand what is actually happening, you need to dig deeper and analyse conversion paths, including not only the last click and CTIT, but also earlier assist clicks and the time intervals between those clicks:

Browsing through conversions with a very short time to install, we can see that they come mainly from networks A, B, C. What’s more, they are very often accompanied by a click from another of these networks in the very same second.
We can also see that in this way a great many installs were “stolen” from Google Ads, Facebook and Landing Page traffic. It is also likely that in cases such as the first two conversions in the illustration below, the app was downloaded earlier from an organic source, for which clicks are not reported by AppsFlyer.

How fast can an app (usually several dozen MB) be downloaded? If a human does it, it is hardly possible in less than 15-30 seconds, and that is without reading any information about the app – which means the user uncritically installed something an ad served them, or had already been exposed to the app through other advertising activities.
If the install happened in less than 15 seconds, you can be practically certain that its actual source is another interaction. In most cases this will be evidence of hijacking or click spam, although it may happen that these are clicks from users who already had the app installed but had not used it before. Such an ad will have a function similar to remarketing.
A zero interval between clicks on different ads is clear evidence of ad stacking (clicking multiple ads simultaneously). Nevertheless, clicks occurring within a few or even a few dozen seconds of each other should also be considered unnatural.
Of course, it may happen that a user deliberately clicks several ads in a row within a short time, but if such a phenomenon is widespread, these clicks are most likely virtual (generated without the user’s conscious participation) or forced, e.g. by an ad unexpectedly appearing on a game screen.
The ad suddenly appears in the clickable area of the game and is involuntarily clicked by the player.
An analysis of such events showed that their share in clicks from Facebook, Google and the Landing Page is negligible, while in networks A, B and C it amounts to a dozen or so percent:

That is a lot, but it is still not a qualitative change that would alter the overall picture of the profitability of individual sources. The results of networks A, B, C, even after being corrected by a dozen or so percent, will still be far better than Facebook’s and Google Ads’.
Suspicious publishers
The suspicious conversion alerts described above are cases of being “caught red-handed”. They indicate a significant probability that invalid clicks are associated with a given install. Let’s remember, however, that these are only the obvious cases, and many invalid clicks may simply go unnoticed.
When analysing invalid interactions, you should focus not on clicks, but on individual publishers or apps. Ad networks currently do not usually share detailed information about the specific apps in which an ad was displayed, at most identifying the publisher as a string of characters.
Some of these networks allow you to block such a publisher and prevent them from displaying your ad, so you should look for candidates for exclusion in order to improve traffic quality. This is somewhat justified: if a publisher has been repeatedly caught engaging in dishonest practices, they probably do it programmatically.
In the case in question, it turned out that among the publishers (apps) where we observed anomalies, such situations were not isolated. The record holders had more than a thousand, and even more than 5,000 suspicious installs to their name. If we assume that more than 20 cases of suspicious intervals and CTIT are grounds for invalidating transactions from a given publisher, then 92% of transactions from networks A, B and C would be invalidated.

The result of the analyses was blocking a large number of publishers and moving budgets to networks where the share of suspicious installs was lower.
Read also: Ad fraud – scams in performance marketing and Discount coupons – a great promotion or manipulation?.
