
Attribution modeling uses a range of terms that aren’t always obvious. So it’s worth putting them in order.
Previous article (part 2): Channel groupings
Conversion
In digital marketing analytics, a conversion is usually the name for a desired action on a website or app that a user completed. This can be a transaction, a form submission (a lead), a link click, reaching specific content, and so on.
In 2024, Google Analytics introduced a terminology change and what were previously called conversions in Analytics were renamed key events, while the term “conversion” was reserved for events exported to and shared with Google Ads. Some illustrations in this article, created earlier, may point to key events in Analytics as conversions. In this article, the use of the word “conversion” (in the general sense) will not always match Analytics terminology.
Interaction, click, visit
Interaction is the broadest term, covering all of a user’s contacts with marketing activities that can be reported on the path leading to a conversion.
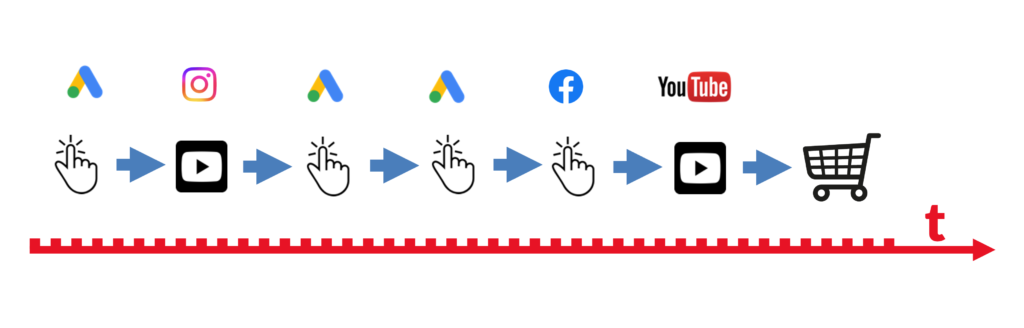
Above: Many different interactions can occur on the path leading a user to a conversion.
There’s no closed catalog of interactions, but most often we’ll encounter the following:
Impression
An impression occurs when a user visited a page that contained an ad. This doesn’t mean they saw it. If no other interaction with the ad follows, we can’t determine that, because devices don’t report which part of the screen the user’s gaze is focused on (there’s also the question of how wide that “seeing” should be).
The user certainly didn’t see some served ads, because they were outside the part of the page displayed. That’s why some systems separately report viewable impressions, i.e. those that appeared on screen.
There are various standards for classifying an impression as viewable — sometimes it’s enough for a single pixel of the ad to appear on screen. Usually it’s assumed that for an impression to count as viewable, at least half of the ad should be visible on screen for 1 second for display ads and 2 seconds for video ads.
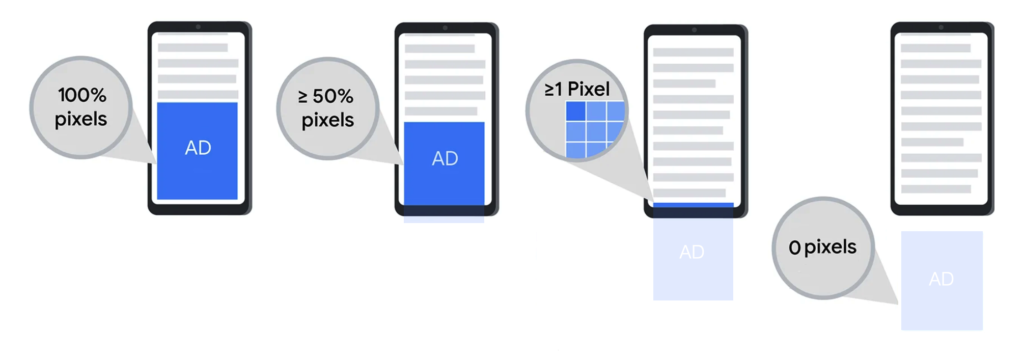
Above: Four cases of an ad being served, of which only some will be reported as a viewable impression. Graphic based on Think with Google materials.
View
A view is a measure used for video ads and means that a video played for the user for a specified period of time.
Individual reporting systems define this period differently. It can be values in the range from 1 to 30 seconds, and they can differ for different types of ads.
It’s worth making sure how a given system reports views and viewable impressions.
Engagement
Engagement is a distinguished category of interactions that are something more than just an ad impression and indicate that the user probably noticed the ad. An engagement can be:
- watching a video (for some minimum time)
- adding a reaction (e.g. a “like”) to the advertised content
- clicking other buttons, e.g. “subscribe”
- adding a comment to the ad
- using an interactive ad feature (e.g. hovering the mouse over a specific area of the ad)
A special type of engagement is also a click on an ad that leads to a visit to the site.
You have to remember that some systems reporting engagement conversions (e.g. after watching a video) may include, in engagement conversions, only engagements that aren’t clicks.
Without such deduplication, post-click conversions would also be reported in engagement conversions, i.e. they’d be reported twice (an analogous situation happens with view-through conversions).
This is one of the reasons why a click is sometimes treated as a separate type of interaction and not counted as an engagement.
Clicks
To paraphrase a classic, one might say that everyone can see what a click is. Some systems also count adding a reaction (e.g. Facebook’s “like”) or a comment as clicks. In the now-defunct Facebook Attribution system, a click meant only ad-related clicks (visits to the site after clicking a link in organic content on Facebook weren’t counted among them).
Visit
A visit refers to entering a site. In advertising systems it’s sometimes called a landing page view.
Not every ad click, even on a link leading to the advertiser’s site, has to result in a visit to that site. There can be a server overload, a slowdown or failure of the internet connection, an error in the link, an incorrect redirect, or the user simply closes the browser window before the page the accidentally clicked link leads to loads.
It also has to be emphasized that not every visit is a click. In Google Analytics terminology, a direct visit is not a click. Sometimes the term “non-direct click” was used to emphasize that direct visits aren’t counted among clicks, even though they constitute an interaction.
A matter of definition
As you can see, classifying a given interaction as a click, impression, engagement, etc. is a matter of definition, and arguing over which of these definitions is more correct is rather an academic discussion.
It’s always worth checking the definition of a given term in the system whose data we’re analyzing. This will be especially important when comparing data from different systems, so as to compare “apples to apples”.
Path data
Path data indicates how much time elapsed and how many interactions occurred on the conversion path. It’s reported within the conversion window, i.e. the period in which interactions can be taken into account when attributing a conversion (see also the article on conversion windows).
Time lag
Time lag tells us how much time a user needs in order to convert. In this measure the reference point is important — whether we count it from the last interaction or from the first interaction.
- time from the first interaction will usually be a more reliable indication of how far the path stretches over time and will be one of the hints for how long the conversion window should be;
- time from the last interaction can be used to assess when campaign results can finally be summarized — when it’s longer, reports done right after a campaign ends may understate the results.

Above: The time-lag report in Google Ads. Measurement is possible from the first or last interaction and by days or hours.
Path length
This section (updated in January 2024) refers to solutions used in Universal Analytics (the previous version of Google Analytics). Attribution still works in an analogous way today in Campaign Manager (the ad-tracking tool of the Google Marketing Platform).
Path length indicates the number of interactions leading to a conversion.

The conversion path length is an important hint of how much attribution modeling using different models can provide additional data for analysis and optimization. If most conversions happen after a single ad interaction, the results for different models may be very similar. This doesn’t mean path analysis won’t make sense here — but then you’ll have to focus the analysis on the segment of conversions that have a path longer than 1.
Reporting time
Reporting time says in which period we report conversions (it shouldn’t be confused with the concept of the conversion window). We can report them by conversion time, i.e. at the time they actually occurred, or by interaction time, i.e. attribute them to the moment at which the interaction (or interactions, if we use a multi-touch model) took place.

Depending on the choice of how to report over time, report results may differ. Both methods have pros and cons and are the preferred ways of reporting depending on the report’s purpose.
| Reporting by conversion time | Reporting by interaction time |
|---|---|
| The key event is reported on the day the conversion or event actually occurred. | The conversion is attributed to the dates on which the interactions it was attributed to took place. |
| Typical of analytics systems. | Typical of advertising systems; it makes it possible to link revenue (conversions) with the cost incurred on ad campaigns. |
| Conversions reported in a given period won’t change, but we can observe conversions from campaigns that ran in earlier periods — up until the conversion window closes. For example, when the conversion window is 90 days, conversions from a campaign run in June may appear in the reports for July, August, and September. As a result, conversions without visits may appear in reports if a campaign has ended but users who interacted with it earlier are still converting. | The number of conversions reported in a given period will grow over time, until the conversion window closes. For example, when the conversion window is 90 days, conversions from campaigns run in June will keep being added to June’s reports over the course of July, August, and September, if they followed an ad click in June. As a result, reports will show different results depending on the day they’re generated, and only after the conversion window has elapsed will the reports remain unchanged. |
| This is the default reporting in Google Analytics, but the Analytics model comparison also allows selecting the reporting-by-interaction-time option. | This is the default reporting in Google Ads and Meta ads (Facebook, Instagram). In Google Ads there’s optional reporting by conversion time (additional report columns). |
| Regardless of the choice of attribution model, the total number of conversions in a given report is the same. Example: a conversion occurred in February after two clicks, the first in January, the second in February. Regardless of the attribution model, 1 conversion will be reported in February and 0 conversions in January. See also the illustrations below. | Depending on the attribution model, the total number of conversions in a given report will differ, because some interactions will fall outside the reporting period. Example: a conversion occurred in February after two clicks, the first in January, the second in February. The data-driven model assigned each of them a 50% share in the conversion. In the February report under the data-driven model we’ll see 0.5 conversions (the remaining 0.5 will be reported in January). Under the last-click model, February will have 1 conversion and January 0. |
| Makes ongoing operational reporting easier, because reports don’t change over time and the attribution model doesn’t affect the reported total. | Makes it easier to assess the effectiveness of marketing activities, because it ensures revenue and spend are commensurate. |
Reporting time can also affect the total number of all conversions. With reporting by conversion time it will be constant:

It will be different when we report by click time. Here the attribution model can affect the total number and value of conversions.

Above: The total number of conversions and revenue reported by interaction time will differ from one another. For reports covering recent periods, these will probably be lower values than with reporting by conversion time, because the effects of current ad campaigns will only appear in the future and will then show up in these reports.
Next article (part 4): The conversion window (lookback window)
Worth reading: A guide to attribution in Google Analytics
