Markov chains, alongside Shapley value, are one of the most common methods used in algorithmic attribution modeling. This article describes the idea of Markov attribution and shows how it is calculated.
What is the Markov chain?
The Markov chain is a model describing a sequence of possible events in which the probability of each event depends only on the current state.
An example of a Markov chain may be the following process:
I am going for a week’s holiday. The likelihood whether I will do sport or just relax there, depends on where I spend my vacation (mountains or beach). The risk of injury during relaxation is negligible, while sport involves 1/10 probability of an accident:
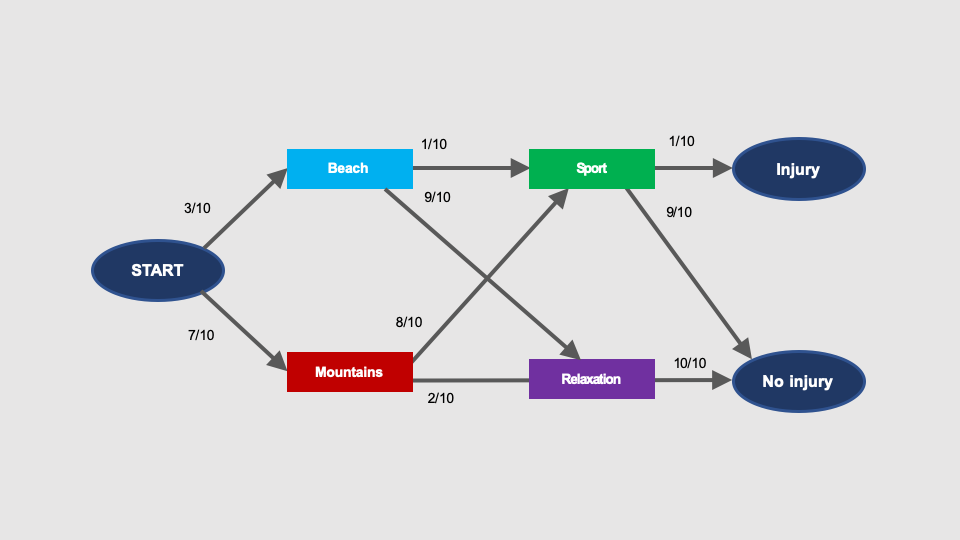
The graph shows that an accident can happen when going to the beach as well as and in the mountains.
The probability that during given vacation I will go to the mountains AND I will have an accident there (i.e. START > Mountains > Injury), is:
P(injury, mountains) = 7/10 × 8/10 × 1/10 = 56/1000 = 5.6%
The likelihood that the given holiday I will spend on the beach AND I will have an accident there (i.e, START > Beach > Sport > Injury) is:
P(injury, beach) = 3/10 × 1/10 × 1/10 = 3/1000 = 0.3%
In this process, there is no other way to have an accident. The total probability of an accident is thus:
P(injury) = P(injury, mountains) + P(injury, beach) = 5.6% + 0.3% = 5.9%
It explains why I return home with a leg in a cast every 5-6 years if I travel three times a year.
Markov chains and conversion paths
How can we use Markov chains to analyse multi-channel conversion paths?
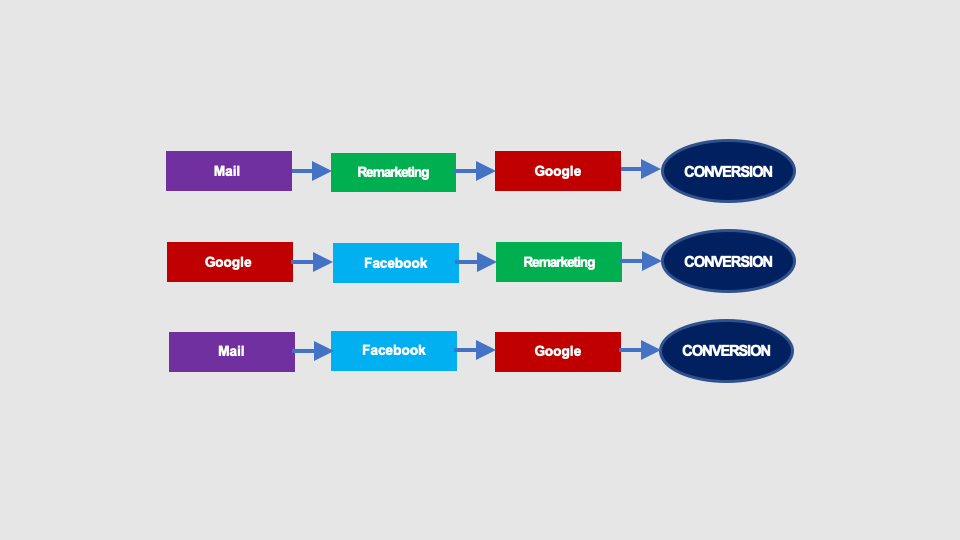
Imagine that we have only four paths, two of which are converting. Conversion rate is therefore 50% (yes, it is high, but on such numbers it will be easier to understand the calculations).
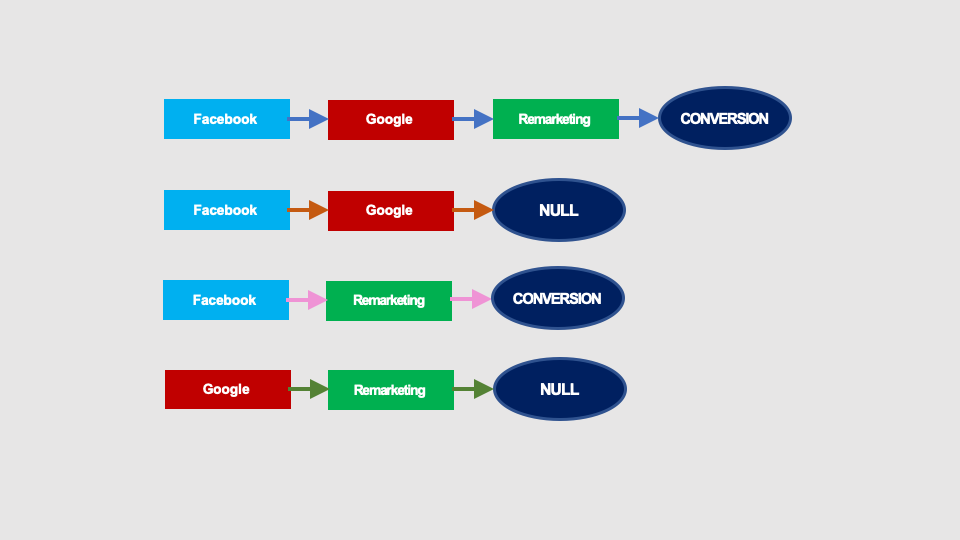
These paths can be presented as the following graph:
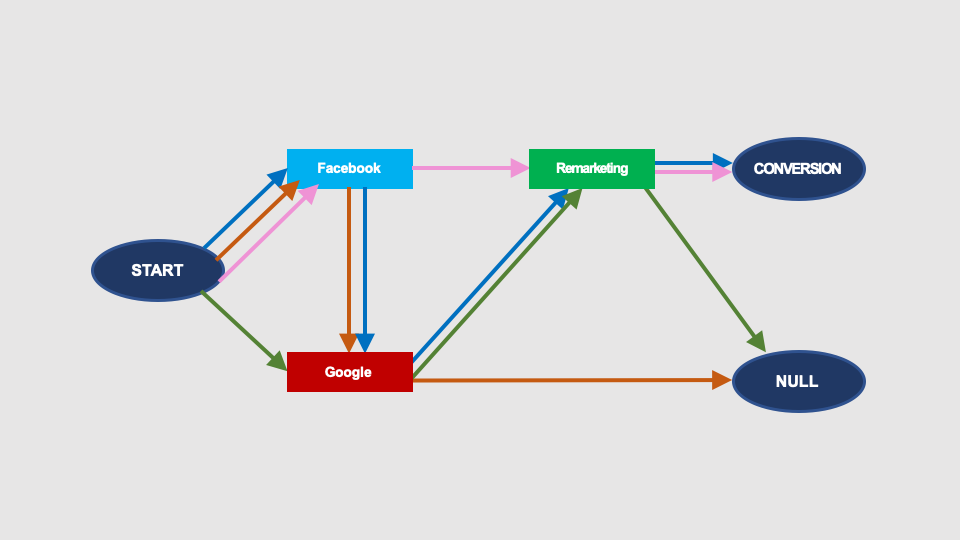
For better readability, instead of multiple arrows, we will use single arrows (arcs) labelled with the number of conversion paths included in the given arc. This number, divided by the count of all arcs outgoing of the given node, represents the probability of transition between the graph nodes:
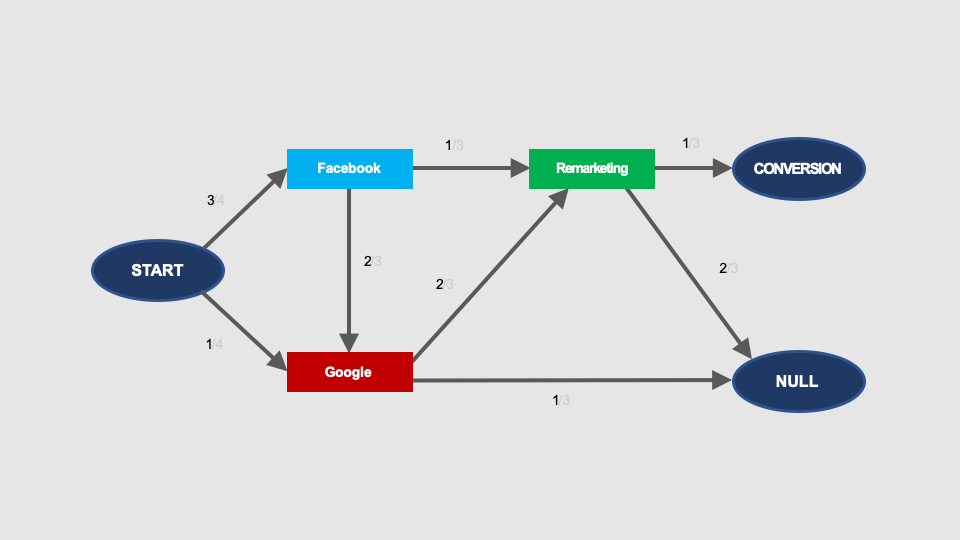
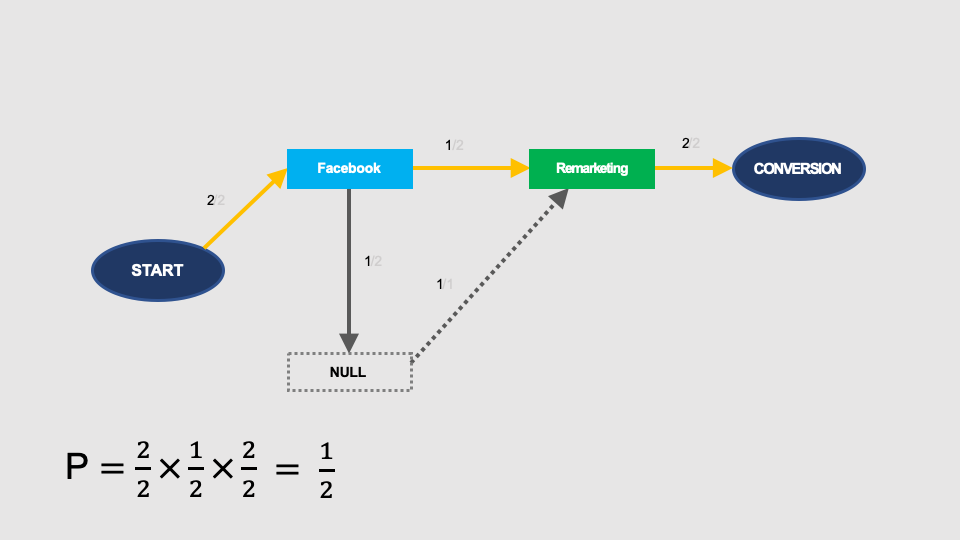
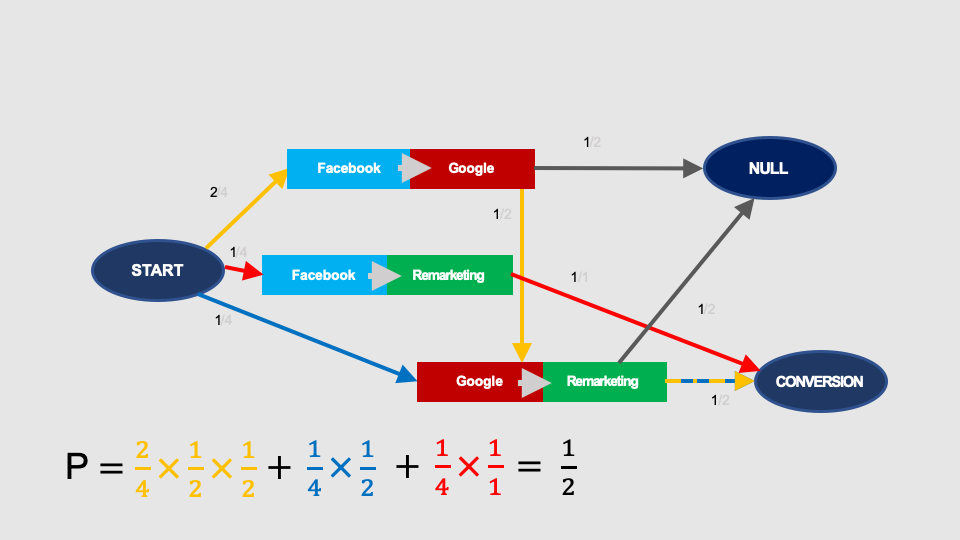
Let’s see now what is the probability of conversion in this graph.
In order to calculate it, we have to sum up the probabilities of conversion for all possible paths in the graph that lead from the START node to the CONVERSION node.
In this case, there are three such paths, marked in different colours:

The total probability of conversion in this graph is 1/2 (i.e. 50%), which is the same as the conversion rate of the analysed paths (four paths, two conversions).
Please note that the paths of transitions in the Markov chain graph leading from START to CONVERSION or NULL (no conversion), are not the same as the conversion paths.
Markov chain attribution
The Markov chain attribution modeling is based on the analysis of how the removal of a given node (a given touchpoint) from the graph affects the likelihood of conversion.
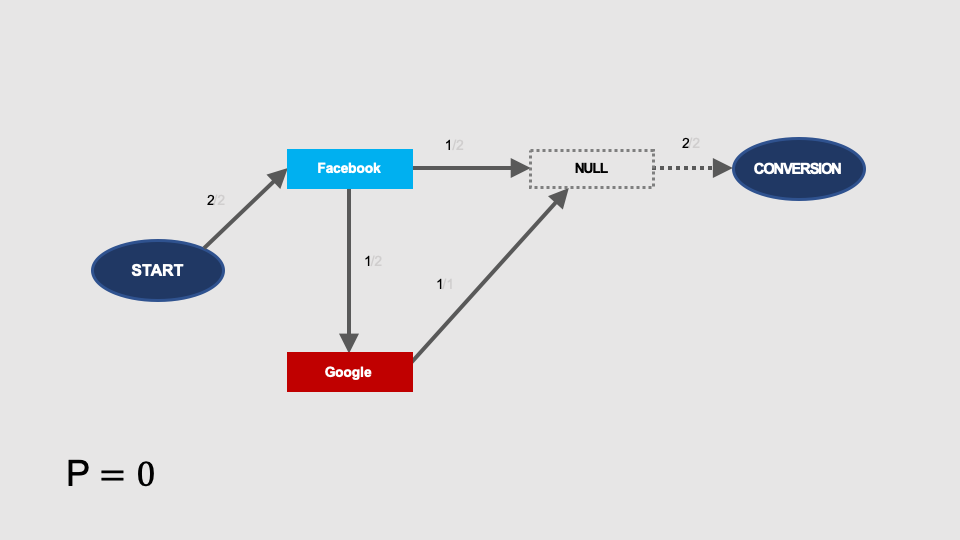
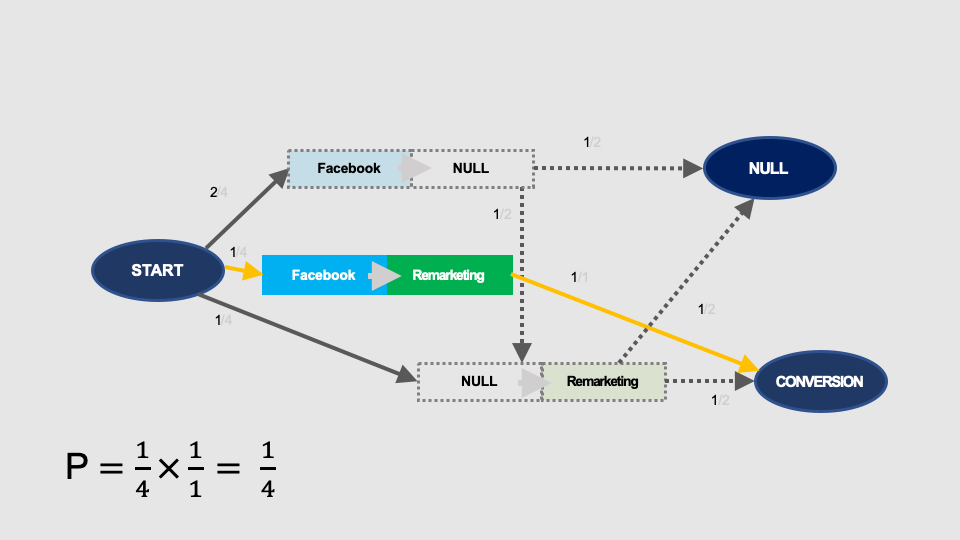
Let’s see what happens if we remove Facebook.
Arcs (arrows) outgoing of this node will cease to exist. Therefore, in such a truncated graph there is only one path from START to CONVERSION (marked in red). Its probability is 1/9:

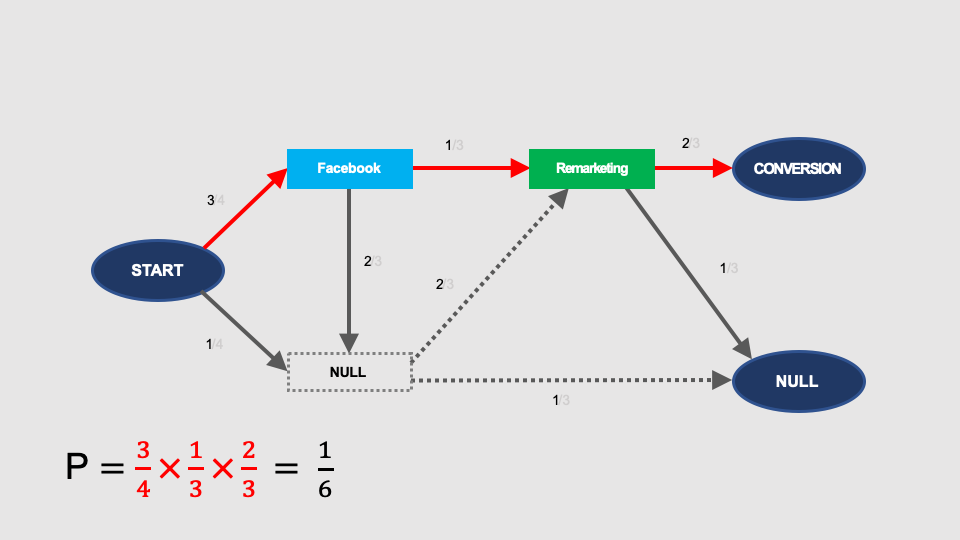
Similar calculations made for Google, give a result that after removing this node, the probability of conversion is 1/6:
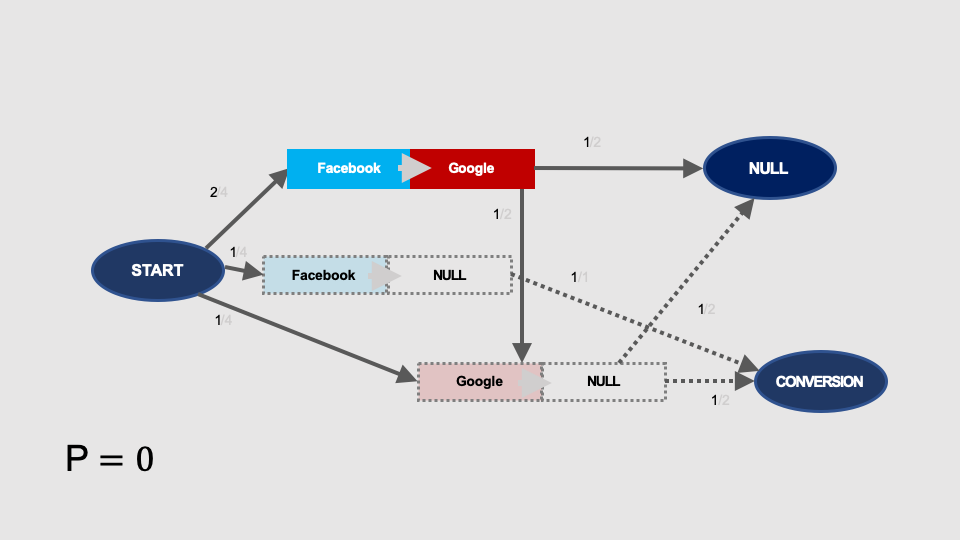
After removal of remarketing, there is no path from START to CONVERSION in this graph. Therefore, the probability of conversion without remarketing is zero:

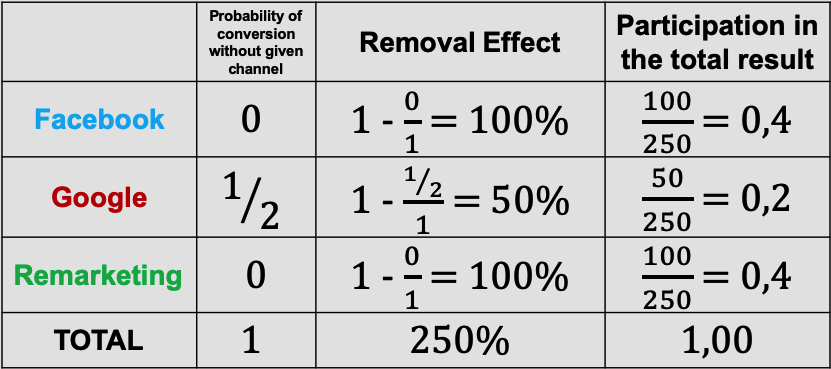
The next step is to calculate the Removal Effect for each node of the graph. It is calculated according to the formula:
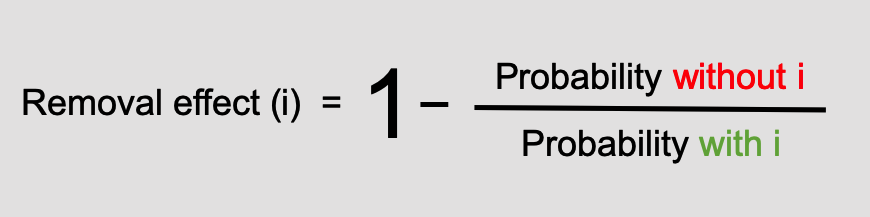
The removal effect represents the percentage of all conversions that will likely to be lost if you remove the given channel (touchpoint).
The removal effects of all nodes do not sum up to 100%, therefore in order to calculate the shares in the result, the removal effects must be normalised, i.e. reduced proportionally so that they total up to 1 (100%).
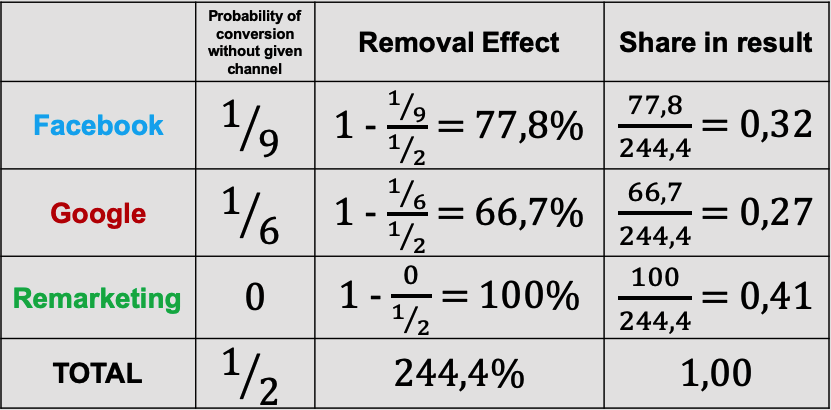
Of course, in order to calculate the conversions attributed to a given channel, we have to multiply the share in the total result by the total number of conversions. In our case, we have 2 conversions (two paths with one conversion each). The attribution in the Markov chain model in this case will look like this:
| Channel | Share in result | Conversion attribution |
| 0.32 | 0.32 x 2 = 0.64 | |
| 0.27 | 0.27 x 2 = 0.54 | |
| Remarketing | 0.41 | 0.41 x 2 = 0.82 |
| TOTAL | 1.00 | 2.00 |
Lack of non-converting paths data
There are no instant reports including non-converting paths in Google Analytics
You can try to obtain the non-converting paths data by creating a ‘pageview’ goal (any visit to the website is a conversion) or extract data about visits using segments in Google Analytics, or, preferably, use another tool to track interactions and conversions, e.g. Campaign Manager (Google Marketing Platform).
The Top Conversion Paths report in Google Analytics contains only converting paths:
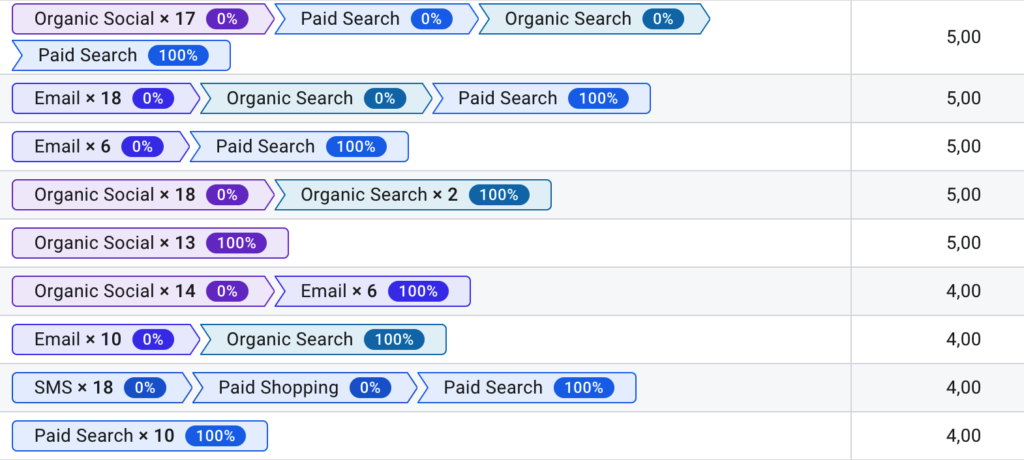
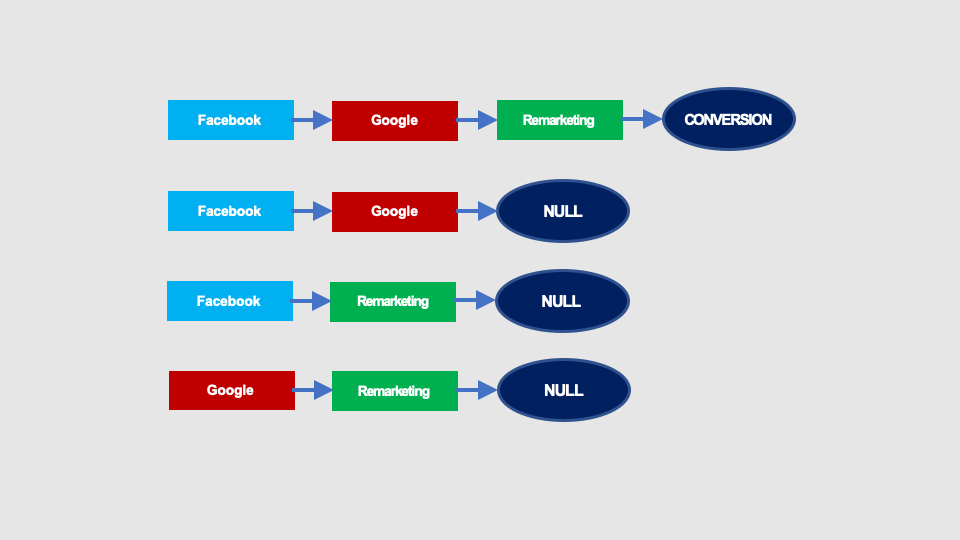
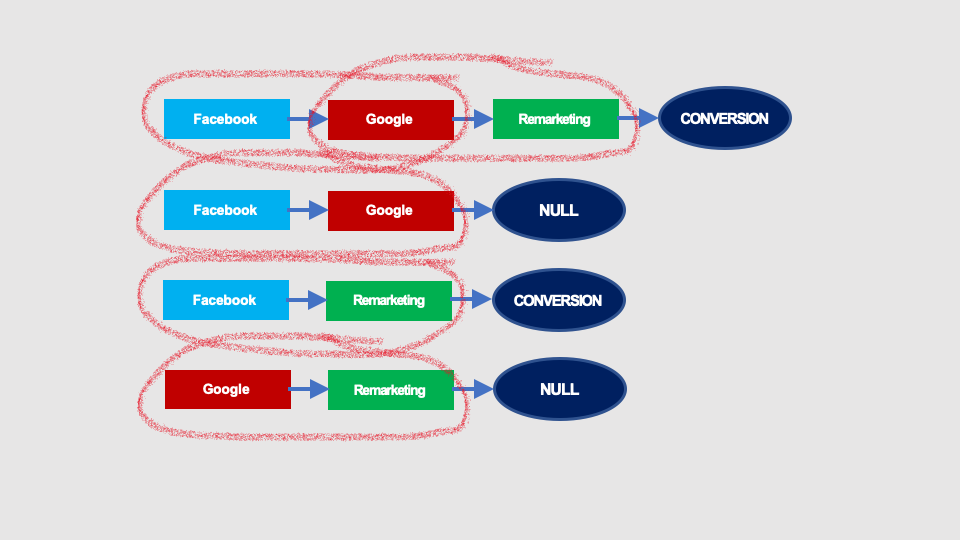
It is possible to build Markov chains using only converting paths. The converting paths in our example campaign are shown below:

The Markov chain graph will look like this:

In such a Markov chain the probability of conversion is 1, because all paths in the graph lead to CONVERSION.
As in the previous examples, let’s calculate the removal effect for individual channels. The likelihood of conversion after removing Facebook is zero:

Without Google, the probability of conversion is 1/2:
After removal of the remarketing, the probability of conversion is zero:
We can calculate now the shares in the total result for each individual channel:
An interesting fact is that in this case the Markov chains model gives the same attribution as the linear model. It’s not a coincidence.
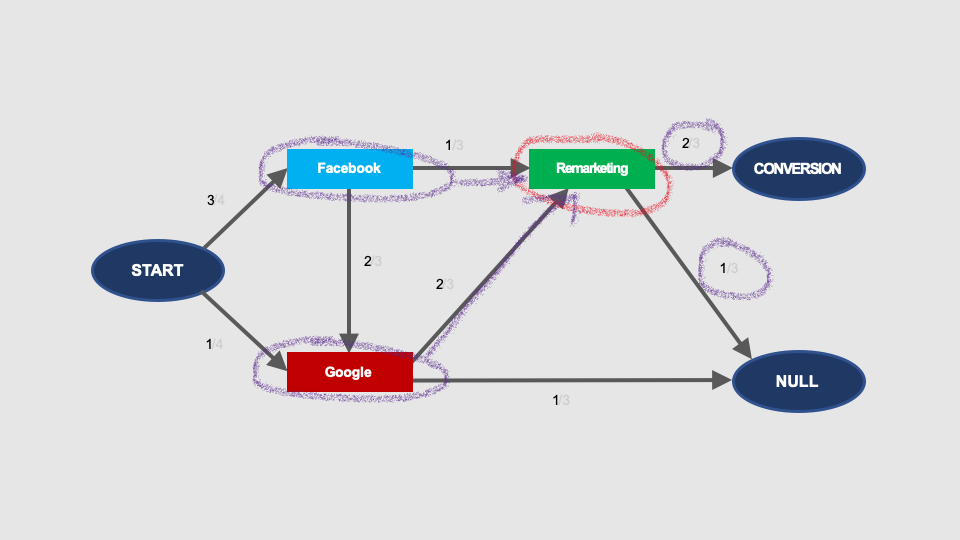
However, this is not a rule. The Markov chains and linear models will give identical results only in case of less complex graphs. In case of the conversion paths below, the result will be different:
The graph based on the paths above will only be a bit more complex than in the previous example, but what makes it different, it’s the presence of loops in the graph (marked in yellow):

Loops
Loops in Markov’s chains significantly complicate the calculation of the conversion probability. The complication results from the fact that there are infinitely many possible paths leading from START to CONVERSION in the graph, because each loop can be entered any number of times.
Let’s see how it looks like in case of simplest loops.
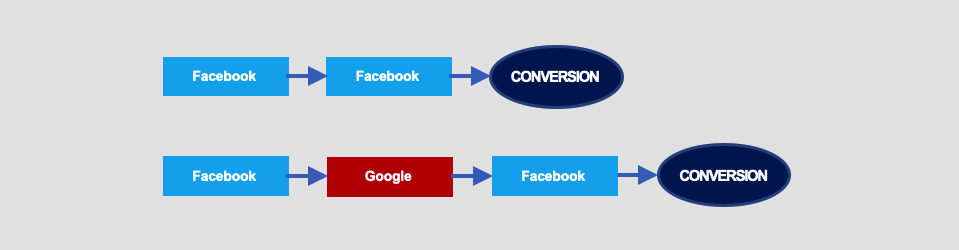
Say, we have two converting paths:
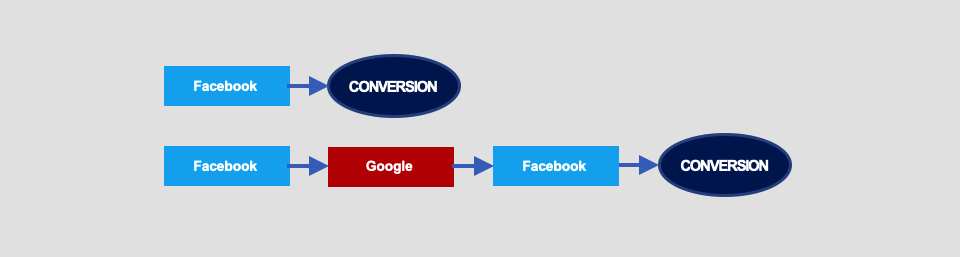
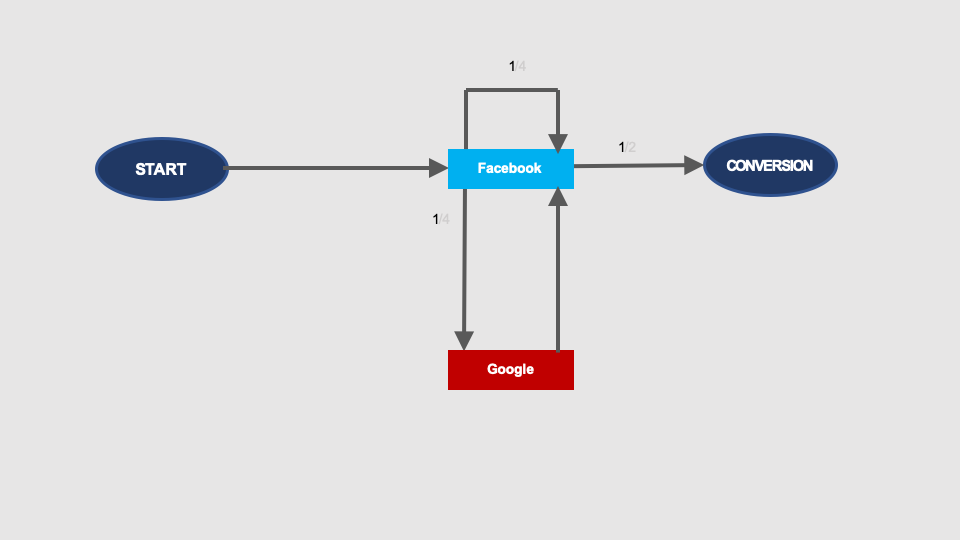
The Markov chain graph for these interactions is as follows:
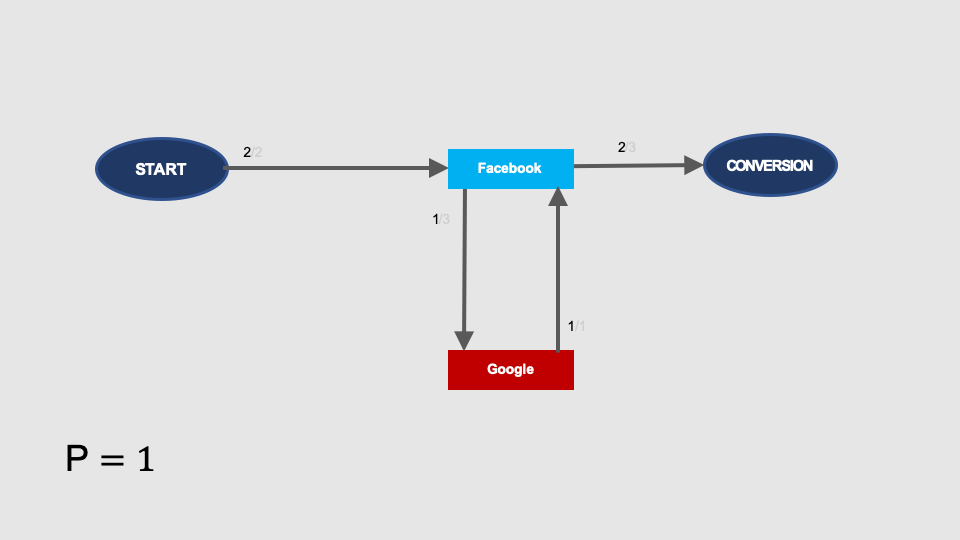
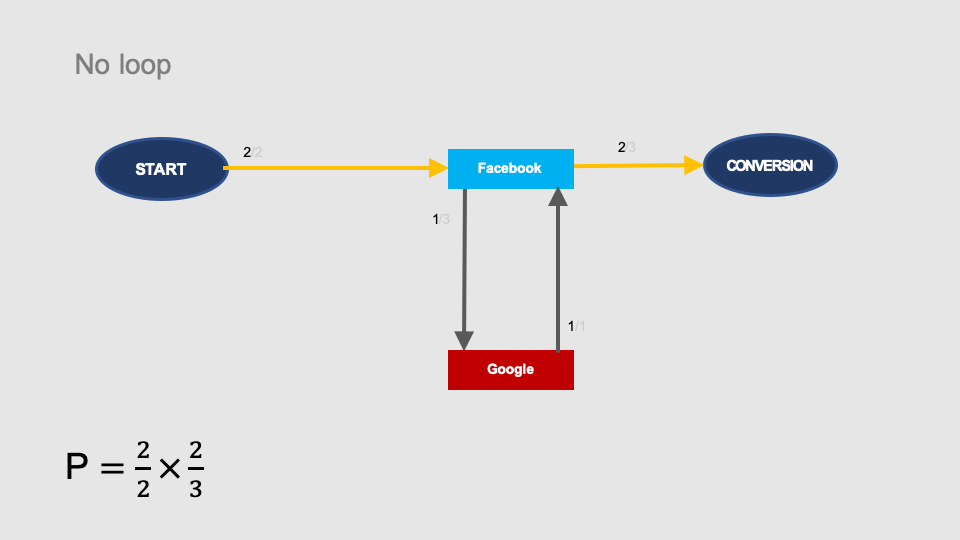
We know that the total probability of conversion is 1 (all paths convert), but let’s see how we can calculate it in the graph. The simplest path from START to CONVERSION does not contain any loop and represents the START > Facebook > CONVERSION path in the graph. Its probability is 2/2 × 2/3:
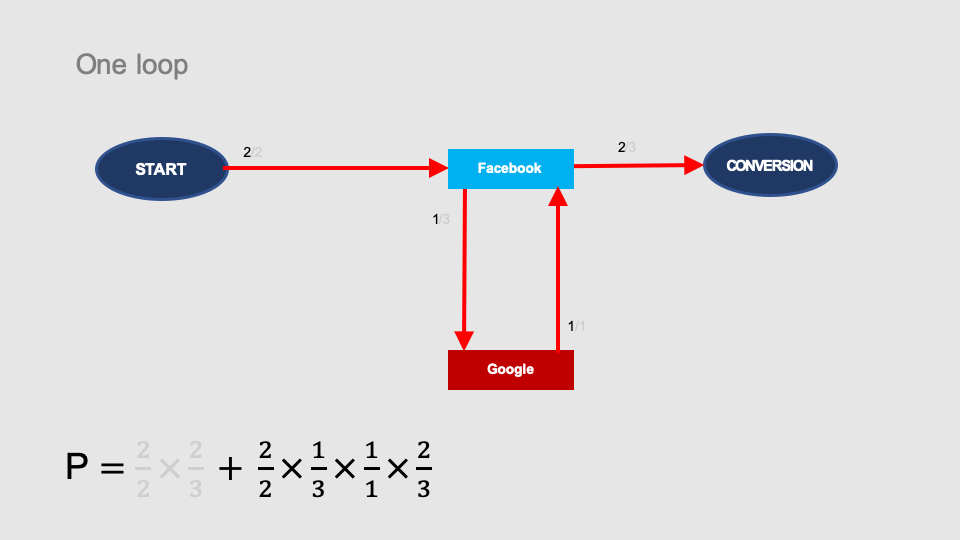
You can also get from START to CONVERSION by making one loop through the Google node: START > Facebook > Google > Facebook > CONVERSION.
After adding it, the probability of conversion increases by another component:
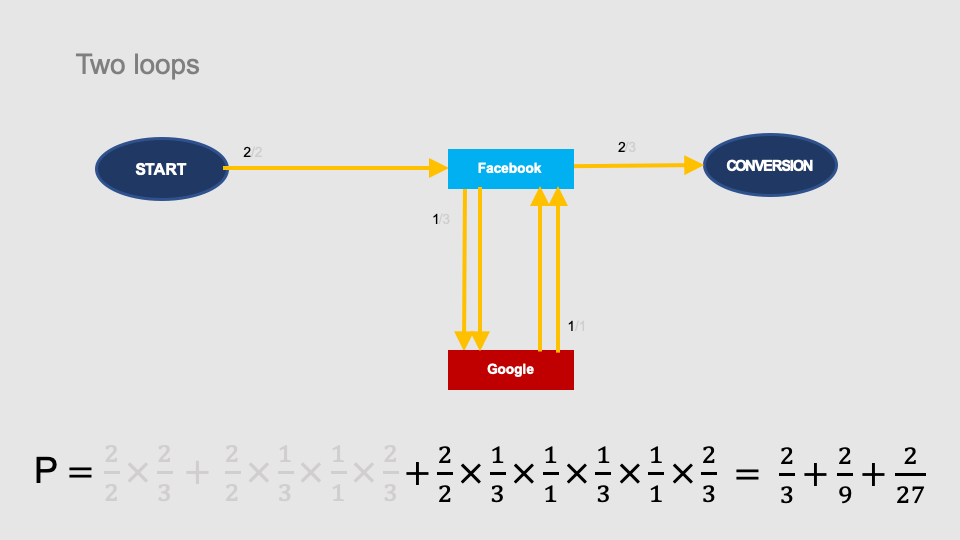
A double loop (START > Facebook > Google > Facebook > Google > Facebook > CONVERSION) generates another component of the conversion probability:
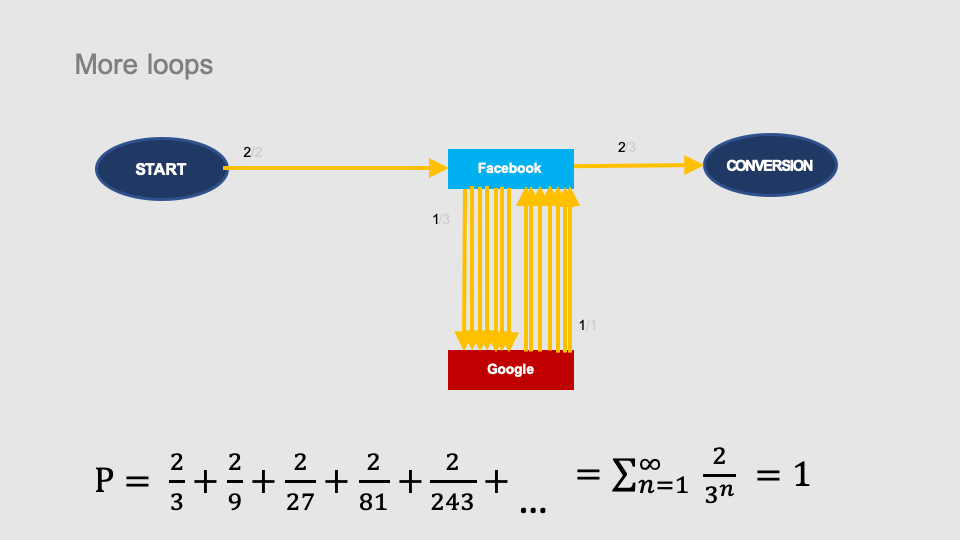
After adding infinite number of loops, the total probability of conversion will approach 1 (100%) in the limit:
It becomes even more complicated if there is more than one loop in the graph. See the example below:
The Markov chain graph will look like this:
The calculations in this case will be more complex. The transitions on the paths may enter both loops (loops via Google or via Facebook node) in a different order and we have to take into account all possible permutations.
In this case, there are two paths including one loop, four paths including two loops, 8 paths including three loops and for n loops there are 2n possible paths:
In the case of more complex graphs it will be even more complicated.
Repetitions of interactions
See what happens if in our example conversion paths…
… one repetition of interaction (Facebook) would appear on one of the paths:
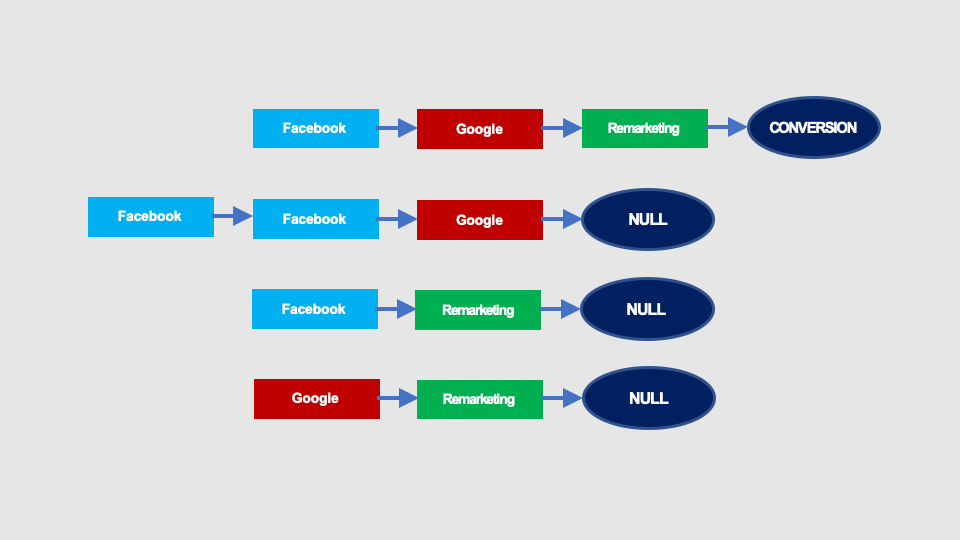
This modification of the graph would look as shown on the picture below. At the top there is a graph without repeating interaction with Facebook, and below you can see the same graph including a loop representing the repetition of the interaction with Facebook:
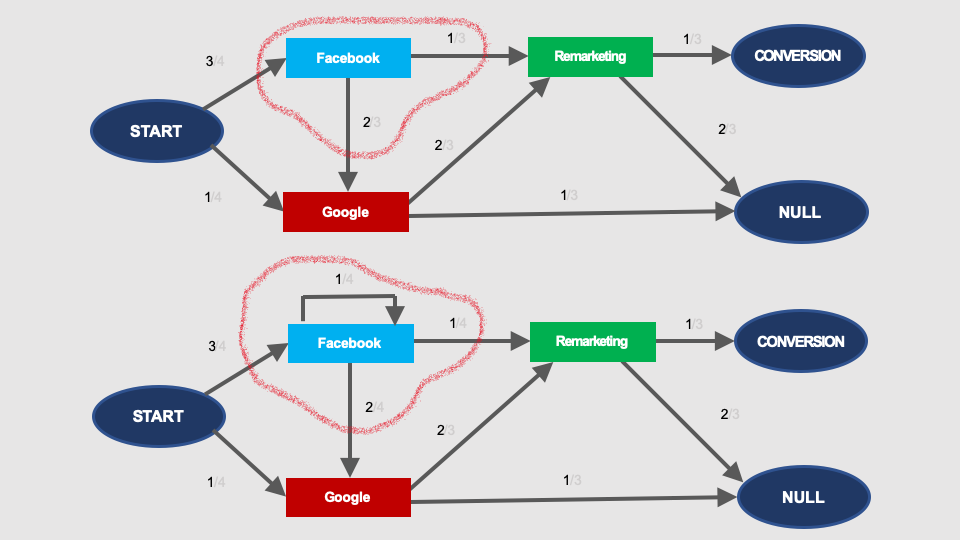
Calculation of such a loop is trivial. See the picture below: The removal effect of the node without the repetition (at the top) will be exactly the same as the removal effect of the node with the repetition (below):

Therefore, for the purpose of calculating the probabilities of transition in the graph, and in consequence, for the purpose of attribution modeling, repetitions do not change anything. Graphs with and without repetitions are equivalent.
In other words, if there are repetitions on the conversion paths, e.g.:
Facebook > Facebook > Google > Remarketing > Remarketing
this path is equivalent to a path without these repetitions:
Facebook > Google > Remarketing
The repetitions can be simply ignored, and we can replace the repeating interactions with a single interaction.
Higher order Markov chains
According to the definition, the probability of transition to a given state in the Markov chain depends solely on the current state. We can say that the nodes of the Markov chain “have no memory”.
What does this mean in practice? Take a look at the graph below.
The probability of conversion after interaction with Remarketing is 2/3 – regardless of whether the previous visit was from Facebook or Google:
We know that this is not really true. The effectiveness of remarketing will be radically different depending on how the audience was built, whether it contains users who previously searched for your product on Google, or people who has just shown interest in your post on Facebook.
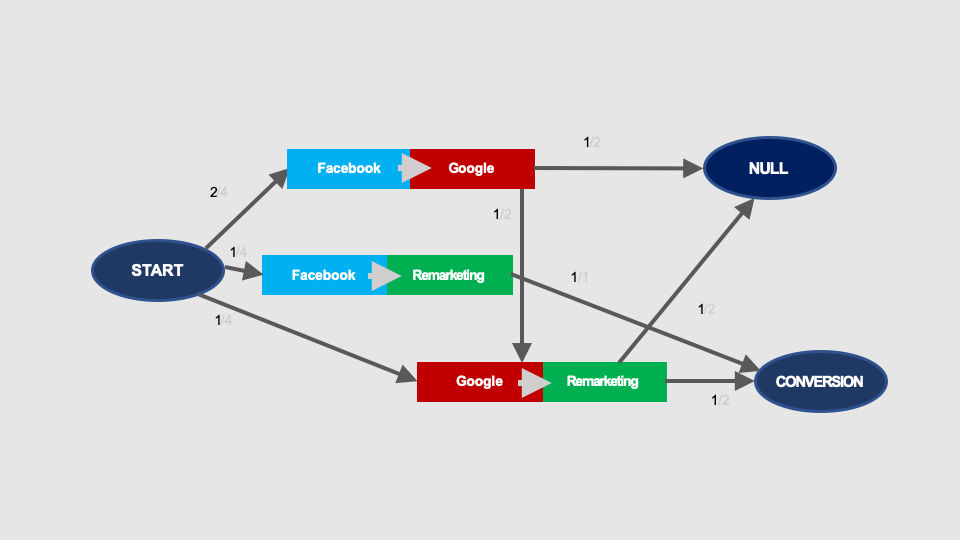
This issue is solved by higher-order Markov chains. In the case of 2nd order chains, the probability of transition to a subsequent state depends not only on the current state but also on the previous state. Therefore, instead of individual interactions, we will analyse pairs of interactions:
The Markov chains graph will look like this:
Calculations of conversion probability are made the same way as in the case of the first order Markov chains. The probability of conversion (sum of three possible paths in the graph, marked with colours) calculated using this graph is still 1/2:
We calculate the removal effects similarly as in the case of 1st order Markov chains.
The removal of Facebook will erase all pairs of interaction containing Facebook and the probability of conversion decreases to 1/8:

Similarly, we can calculate the probability of conversion without Google:
… and without remarketing:
Calculations of the removal effects and shares in the result are the same as in the previous examples:

You can also create Markov chains of the 3rd, 4th and higher orders. Their nodes will have an even longer “memory” and the probability of transition between nodes will depend on the current state, as well as on two, three etc. previous states respectively.
If you will use higher-order Markov chains, you’ll notice that using higher and higher order at certain point does not significantly change the attribution. In practice, Markov chains of a higher order than 4 are rarely used.
Single-channel paths
Markov chains attribution calculations use the normalised removal effect. It causes some problems with single touchpoint paths, i.e. those with only one interaction.
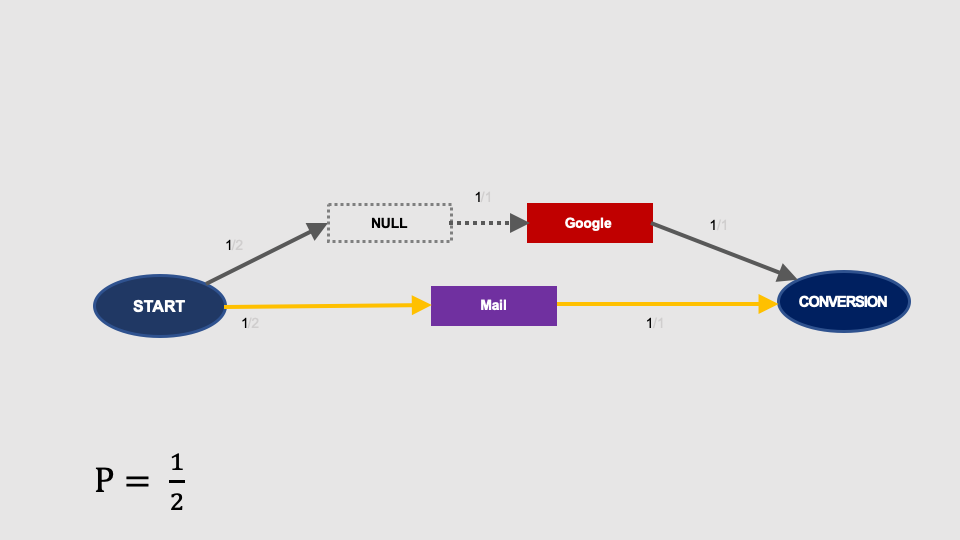
Let’s see the example below. We have two paths here, one of which contains only one interaction, i.e. Mail:

The Markov chain graph will look as follows (probabilities add up to 100%):

Let’s calculate the conversion probability after removal of Facebook…
… Google …

… and Mail:

Calculation of the removal effect, share in the result and attributed conversions is shown below:
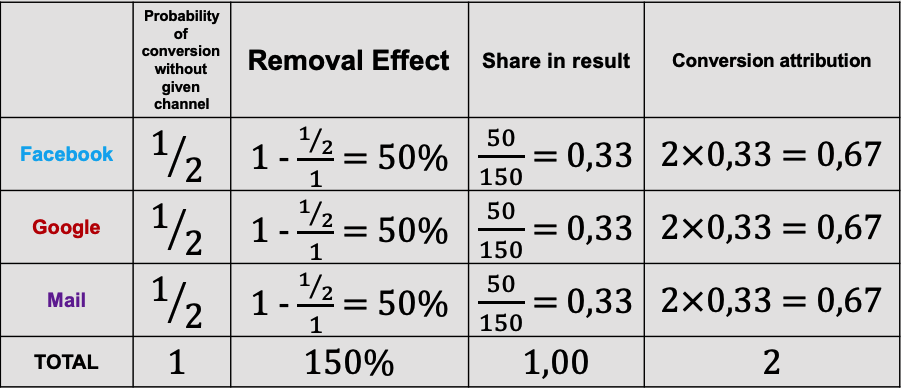
Note that in this attribution model, the Mail channel contributed to 0.67 conversions, which means that the third part of the conversion that occurred after interaction with Mail has been somehow attributed to Facebook and Google.

Since there was no other interaction on the conversion path containing Mail, why do we attribute any share in this conversion to other channels? It does not make sense.
It actually shows that the Markov chains attribution even as a theoretical model is a kind of approximation.
One of the solutions used is to remove single-channel paths from the Markov chains analysis. Since only one channel is involved in the conversion, the attribution is obvious (we attribute it to this one channel only) and there is no need for advanced modeling. Thus, we should only calculate Markov chains for conversion paths with two or more interactions, and then we should add conversions from single-channel paths to the attribution of multiple channel paths.
Properties of Markov chain attribution
Markov chain Attribution is an alternative to attribution based on the Shapley value.
It is burdened with an embedded error resulting from the use of the removal effect. As result of normalisation, the attributed value of conversions is unfairly shifted from single-channel paths and other short paths to longer conversion paths.
However, this model has many useful features. First of all, this model is much less sensitive to random data with less statistical significance, which can completely distort, for example, the calculation of Shapley value. Thanks to this, Markov chain attribution can be used for smaller data sets and for larger channel granulation.
Despite certain complexity associated with graph loops, Markov chains require less computing power than Shapley value, which makes Markov chains attribution suitable for analysing higher numbers of touchpoints.
Markov chains often give results oscillating around the results of the linear model.
Markov chains are not so much sensitive in terms of detecting click spam as the Shapley value is (click spam are numerous interactions with actually no incremental effect on the total number of conversions).
You should also remember that regardless of the attribution method used, any algorithm that use conversion paths as input data is based on the analysis of correlations. Correlation, however, may indicate causation between interaction and conversion, but it is not proof of it, and therefore these models may sometimes misinterpret signals. For this reason, these algorithms do not detect conversion hijacking (like brand bidding, discount coupons etc.), as conversion lift methodology does.
Nevertheless, the comparison of Markov chain attribution to the linear model and other models can provide valuable signals for further analysis.