
Google offers an algorithmic attribution model (data-driven attribution) in Google Ads and Analytics, as well as in Campaign Manager. How does it work, and is it really the best attribution model?
Previous article (part 8): Multi-touch models
In this model, the split of a conversion across interactions is calculated according to an individual rule which, on top of that, changes over time based on the conversion data of the given site, using machine learning and artificial intelligence.
The algorithm is based on analyzing converting and non-converting paths, comparing their conversion probabilities and determining a given channel’s fractional value on that basis.
For example, let’s assume that for a user who entered the site from a search engine (search) and then received a newsletter (e-mail), the conversion probability is 2%. Moreover, if a display ad additionally appears on such a path, the probability is 3%.
On this basis the algorithm estimates that thanks to the display channel the conversion probability grows by 50% (from 2% to 3%).

Graphic based on Google materials
The details of how the algorithm works are not known. Besides, the algorithm is surely being modified continuously. Help articles describe its workings rather enigmatically, and the information provided there changes relatively often. Google mentions using methods such as the Shapley value, Markov chains and Bayesian inference.
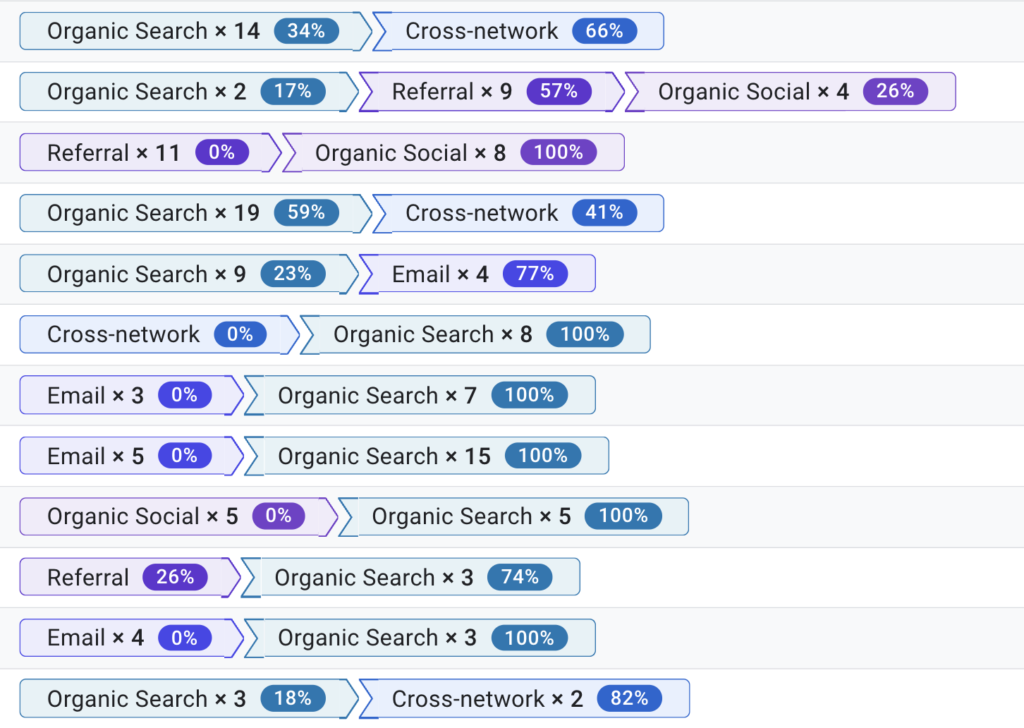
In Google Analytics, in the conversion paths report in the Advertising section, we can see how a conversion is split across the individual interactions on a given path:
Is the data-driven model the best one?
It seems that advertisers expect the data-driven model to assign conversions to traffic sources in the fairest possible way, reflecting the contribution of individual channels to conversion growth.
Attribution like that serves as guidance for budget allocation decisions — both those made by the marketer and those made by the campaign optimization algorithm (e.g. smart bidding in Google Ads).
For this to be possible, these algorithms have to be fed with information about the incremental contribution of individual campaigns to the result — that is, the difference between sales results when a campaign is running and the results that would be achieved if the campaign were dropped.
The biggest problem of algorithmic models in their current shape is that they rely on analyzing correlations between interactions and conversions. This makes them susceptible to detecting spurious correlations and drawing conclusions from them.
Paraphrasing the illustration that describes how the data-driven algorithm works, one could conclude that the presence of storks nearby increases fertility, since the probability that two people who form a relationship and find a place to live will have a child within the next year is 2%, but if there are storks in the area, the probability is 3%.

The actually observed difference in fertility concerned cities versus rural areas, where storks can be seen much more often and where, in Poland in the 1990s, fertility was much higher than in cities (currently these indicators for cities and the countryside are similar; in 2020, for the first time in many years, fertility in cities was higher than in the countryside).
Data-driven in search
In Google’s materials we can also find this example describing how the data-driven model works in search results:

Comparing the conversion data of path ABC (on which click A occurred) with a path that differs only in that click A is missing, i.e. path BC, we conclude that path ABC has a 50% higher conversion probability (an increase from 2% to 3%).
The mechanism is understandable: a user who is looking for a gift idea most likely intends to buy one, so compared to other users who are looking for information about tablets, they may have a higher conversion probability.
But was it really the click on the ad related to the phrase “gift gadgets” that influenced the purchase in our store? Wouldn’t the same user, had they visited our site for the first time searching for “best tablets” or even only “tablet nexus 9”, have also completed the transaction? Comparing paths A > B > C and B > C, we are comparing users we know to have an urgent purchase intent (they are looking for a gift) with users who may or may not have full purchase intent.
Let’s consider what would happen if our model also analyzed clicks on other companies’ ads, not just ours. Suppose that when searching for “gift gadgets” the user visited a competitor’s site that also offers tablets, and then — inspired — started looking for information about tablets, to finally choose the Nexus 9.
Let’s assume that people who previously visited the competitor’s site while searching for “gift gadgets” also have a higher conversion rate:

Graphic based on Google materials
Could we also conclude here that the conversion probability increases (in this case slightly less, by 40%) and, on that basis, assign conversion credit to an ad paid for by the competition? And, being consistent, would we conclude that subsidizing our competitors’ ads pays off?
Brand search and the data-driven model
How can the limitations described above affect the effectiveness of the data-driven model? Let’s imagine we are analyzing the behavior of the users from our example who ultimately bought a tablet.
We can see that they searched for “best tablets” and “tablet nexus 9”, after which they behaved as follows: 20% of them bought the tablet right away, while the rest decided to compare offers, after which:
- 40% compared offers and bought from us after searching for our store’s name
- 40% compared offers and bought from the competition
The users who decided to come back entered the site through the ad displayed when they searched for the store’s name — but if it hadn’t been displayed, they would have entered through the link in the organic search results, which currently appears below the ad.
From the perspective of conversion paths, we can see that users who clicked the ad related to the store’s name had a conversion rate twice as high as those who didn’t click it:

In reality, however, if we had switched off the ads on the store name keywords, the total number of conversions would not have changed significantly, because users intending to buy a tablet from us would have entered through the organic results — and if so, the attribution of the store-name ads is zero.
In practice, the algorithm can fail to notice this and sometimes does quite the opposite, deciding that it is precisely the ad on our own name that is crucial for building purchase intent:

Another interaction that results from purchase intent is any remarketing ad. Its impression is a consequence of interest, and a certain share of users would also have bought if the ad had not been shown to them.
Correlation vs. causation
The problem that data-driven attribution algorithms such as the one in Analytics run into stems from the impossibility of determining causality solely by observing data. Meanwhile, it may happen that some interactions are not the cause of purchase intent appearing, but rather its effect.
In the figure below we have the following situation: Interaction 1 (e.g. a social media ad) made the user interested in our offer and they decided to take advantage of it. Interaction 2 (e.g. clicking our ad after searching for our company’s name) was a consequence of that interest, and its impact on growing this interest and making the purchase was negligible (this is represented by the thin arrow in the diagram leading from interaction 2 to the purchase).

The conversion tracking system sees the following data:

From this data it is impossible to read that interaction 2 actually had no impact on the conversion. In turn, paths with only interaction 1 may convert much less often, but this will mean that ad 1 did not spark those users’ interest and therefore interaction 2 never happened.
Seeing that conversions mostly happen after interaction 2, the algorithm may even interpret this as an indication that ad 1 is useless.
For these reasons, based solely on the correlation between clicking specific ads and a conversion, we cannot unambiguously conclude that a cause-and-effect relationship exists between them, nor assess its strength.
How to measure the impact of ads on sales growth?
For centuries people observed that the sun rises shortly after the rooster crows. Did we therefore conclude that the rooster’s crowing causes the sunrise? Not really. It seems people knew this even before they understood the principles governing the movement of planets. A simple experiment sufficed: after the rooster landed in the pot, the sun kept rising.
To determine a causal relationship and measure its significance, observing conditional probabilities is not enough (e.g. the probability of conversion given that the ad was clicked vs. the probability of conversion when there was no click).
To verify a causality hypothesis, mere observation of phenomena is not enough: we have to intervene and artificially remove the factor we suspect of being the cause of the observed effects, and then watch how this affects the observed result.
That’s why the only way to measure the impact of ads is to run a test with a control group, in which, during the test period, the test group is not shown a specific ad.
To do this, we have to block the ad from being displayed to a portion of the target group who would have seen it under normal conditions. Such an experiment is sometimes called a conversion lift test or incrementality measurement:

By comparing the difference in conversions between people who saw the ad and those people from the target group for whom the impression was blocked, the generated conversion lift can be estimated.
Until algorithmic attribution models start verifying the observed correlations with precisely such randomized tests with a control group, they will remain susceptible to errors of this kind.
Conversion lift — case study
We used the conversion lift method with one of our clients. The Romanian travel agency Vola.ro ran a YouTube campaign promoting low ticket prices in January. The ad argued that this is the best moment to buy a ticket, because statistics show that prices are most favorable at that time.
- The campaign achieved 17 million* impressions and a view rate of 47%
- The campaign generated 1832 conversions after viewing the ad
- Additionally, 635 conversions were recorded among users who skipped or stopped watching the ad
- There were only 16 post-click conversions (according to Google Analytics data)
Set against the campaign costs, the post-click effect is absolutely unsatisfactory. There were a lot of post-view conversions, but considering the campaign’s multi-million reach, we can expect that it reached other users on the conversion path who had interactions with search ads, Facebook ads or display network ads — including remarketing. Only 4% of users who converted with the YouTube campaign on their path had no other interactions on it.
Could it then be that these conversions were achieved mainly thanks to the other activities, and most of these customers would have made the purchase even without the YouTube campaign? Only a conversion lift experiment could answer this question. It was carried out using a 30% control group, and the results were normalized to 50% to ensure comparability:
- 2495 conversions were recorded in the test group
- 1831 conversions were registered in the control group
- The difference is 664 conversions
That is exactly how much sales grew thanks to the investment in this YouTube campaign.
For comparison, an analysis was also carried out using various attribution models, including a model based on Markov chains.

Difficulties in using incrementality measurements in algorithmic models
One of the biggest obstacles is the need to interfere with ad serving. To do this, the attribution algorithm (e.g. the one in Google Analytics) would have to block ad serving (e.g. Google Ads) to part of the target group. It could be, for example, a geo lift test based on geolocation, where the control group would be recipients from a specific region.
Currently the link between Google Ads and Analytics is used for reporting Google Ads in Analytics and for feeding Google Ads with audience segments from Analytics or imported conversions. We’re talking about mutual data sharing here.
Analytics controlling ad serving in Google Ads would be a far-reaching step, although technically it seems possible. Except that Google Ads is not the only source of conversions.
Meanwhile, the situation gets considerably more complicated if we wanted to apply this to other channels, e.g. google / organic, because that would mean the Analytics algorithm influencing search results.
And what about Facebook ads or organic social media traffic? A vision in which Meta allows the Analytics algorithm to interfere with the workings of Facebook’s algorithm does not seem realistic in the near future.
It is much more likely that data-driven algorithms will start using control group experiments inside the advertising systems themselves. It would probably be an additional checkbox in which the advertiser agrees to limit ad serving to a certain part of the target group.
Currently (January 2024) this seems to be a rather distant prospect, although both Google and Meta increasingly mention using data from randomized controlled experiments to feed data-driven attribution mechanisms in the algorithm training process.
Next article (part 10): The Shapley value
Worth reading: A guide to attribution in Google Analytics
