
Attribution analysis makes use of mathematical models, which form the basis of algorithmic modeling. One of the concepts that has found application here is the Shapley value. How can it help us in attribution modeling?
Previous article (part 9): The data-driven model
Earlier articles in this series presented various attribution models, from the simplest single-touch models to complex multi-touch models.
However, even the most elaborate custom attribution model will require an arbitrary choice of the base model, as well as of the weights we assign in that model to individual interactions (ad impressions, clicks, video views).
Unfortunately, answers to the question of how to do this are few and far between. Most often we come across advice to “test different models to determine which works best in your case” or “you need to think about what matters most to you and adjust…”.
This problem, common to all — as they are called — heuristic attribution models, is meant to be remedied by algorithmic models, which draw conclusions about the importance of individual interactions for generating conversions based on the available conversion path data.
One of the concepts used in algorithmic attribution models is the Shapley value.
What is the Shapley value?
The Shapley value is a concept from game theory. It determines what payoff a player should expect in a team game, taking into account their average contribution to the game’s result achieved by each possible combination of players.
To understand the Shapley value, you need to become familiar with the concept of marginal contribution. In team games, each player contributes something to the overall result. If different combinations of players can enter the game (different coalitions), then the benefit of admitting a given player (the increase in the game’s result) may be different for each of these combinations.
The marginal contribution of player i to a given combination of players is calculated as follows:

In other words, the marginal contribution determines how much a given combination of players gains in the result when the given player joins it.
There can be many possible combinations of players. They can vary in size (headcount). The simplest combination is one in which only the given player takes part (size 1). Then they can form “two-person” combinations with each of the other players (size 2). And so on, up to the combination in which all the players take part (size n, where n is the total number of players). So combinations will occur in n different sizes, from 1 to n.
The Shapley value is calculated as follows: for all combinations of players containing the given player, we sum that player’s marginal contributions divided by the number of combinations of the given size — and then divide by the number of players:

Splitting income between an entrepreneur and employees
Let’s now try to explain the Shapley value with an example. Imagine a company that can consist of businessman B and employees: P1, P2, P3. Each employee is able to generate revenue of 1 money bag. A company in which the businessman employs 3 people earns 3 money bags:

If there are two employees, the company will earn only 2 money bags. It doesn’t matter whether P1 works with P2, P2 with P3, or P1 with P3 — any two employees employed by the businessman will always earn 2 money bags. If there is only one employee, they will earn only one money bag. The businessman alone, without employees, earns nothing. Without the businessman, the employees alone will not be able to earn anything, regardless of how many of them there are.
Let’s now see how to calculate marginal contributions — using player P3 as an example. To the combination B, P1, P2 (the businessman employing the two other employees), player P3 contributes 1 money bag, because that is the difference between the company’s income with employee P3 (i.e. in the lineup B, P1, P2, P3) and without him (in the lineup B, P1, P2):

In turn, to the combination P1, P2 (i.e. two employees, but without the businessman), player P3 marginally contributes nothing. With him or without him — the earnings are zero:

In our game we have four players in total (P1, P2, P3, B). They can join into combinations of 1, 2, 3 and 4 players. The combinations involving a given player, e.g. player P1, are:
- one single-player combination (the player alone),
- three 2-player combinations,
- three 3-player combinations,
- one 4-player combination (all the players):

In total there are 8 such combinations. In general, the number of combinations a given player can take part in is 2n-1, where n is the number of players (in this case it is 2(4-1) = 23 = 8).
Let’s now see what player P1’s marginal contributions to each possible combination involving him look like, and then do the calculations according to the definition of the Shapley value:

We calculated that the Shapley value for player P1 is Sh(P1) = 1/2 = 0.5. Similar calculations should be performed for the other players, but we can also use the properties of the Shapley value and take a shortcut.
Since the role of players P1, P2 and P3 is identical, the Shapley value for these players will also be the same, i.e. Sh(P2) = 0.5 and Sh(P3) = 0.5.
The fully staffed company (P1, P2, P3, B) produces 3 money bags. The businessman should receive what remains of the total result after “paying out” the Shapley values to the employees:
Sh(B) = 3 – Sh(P1) – Sh(P2) – Sh(P3) = 3 – 0.5 – 0.5 – 0.5 = 1.5
In general, in the businessman–employees game, the Shapley value splits the earned profit in such a way that half of the profit goes to the businessman, and the other half is split equally among the employees.
The Shapley value for conversion paths
Let’s now see how to calculate the Shapley value for a game in which various marketing channels work out a common result.
First, we need to determine what the result in our game will be — or, as a mathematician would say, what the characteristic function will be. The first thing that comes to mind in this case is the result expressed as the number of conversions. In Google Analytics we can find data on the conversions generated by individual paths:
In our example we’ll assume we have three sources: Facebook, Google and Affiliate.
Note that in the Shapley model, the order in which the channels appear on the paths doesn’t matter. For example, the paths:
- Facebook > Google
- Google > Facebook
- Google > Facebook > Google > Google > Facebook
- Google > Facebook > Google
— are all summed into the single channel combination Facebook + Google.
Here is the number of conversions generated by the individual channel combinations:
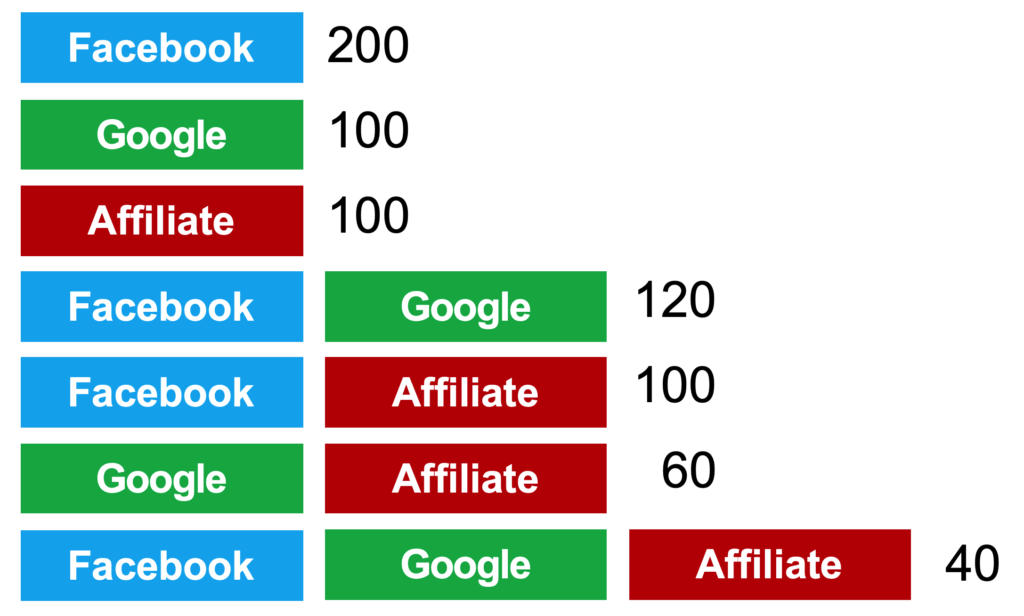
Also note that when we use Facebook and Google, we will be getting conversions on paths containing both the Facebook + Google combination and Google and Facebook working alone. If all three channels take part in the game, our result will include conversions generated by all the channel combinations.
In other words, to get the number of conversions for a given combination, we have to accumulate the values of the paths contained within that combination:
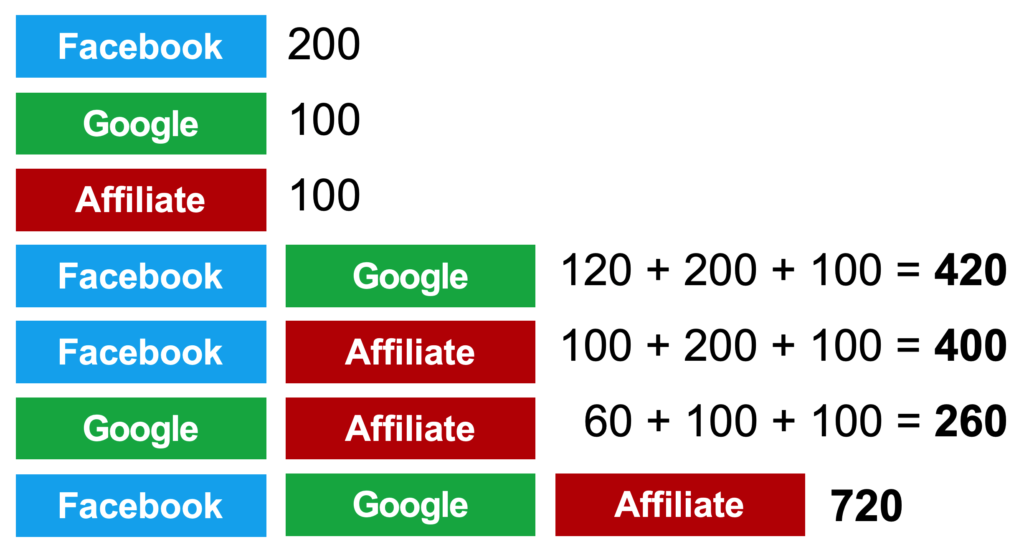
If we assumed that the result is simply the number of conversions for a given combination, we would very often get negative marginal contribution values. If two channels rarely overlapped, their combination would generate very few conversions, which would be read as a negative marginal contribution — so it’s clear this wouldn’t make sense.
Let’s now calculate the Shapley value for the FB channel. Let’s line up the number of conversions for all the combinations in which FB takes part against the conversions of those combinations with FB removed. Then let’s calculate the marginal contributions and plug them into the Shapley value formula:

We obtained Sh(FB) = 323.33. We could now carry out further calculations, but… we’d actually be wasting our time. It turns out that with the game’s result understood this way (with such a characteristic function), the Shapley value simplifies to the following formula:

It means that the Shapley value can be calculated as follows: for each path we divide the value of the generated conversions by the length of that path (the number of interactions on the path), and then we sum the values obtained this way for all the paths. A mathematical proof of this theorem can be found here (PDF, Appendix, pp. 19-20).
This way we can calculate the Shapley value much more simply:

Looks familiar? Yes, the Shapley value calculated on the basis of conversion data for individual paths resembles the linear model — conversions are split equally among all the channels appearing on the path.
The Shapley value for the number of conversions on converting paths is a kind of linear attribution model.
The difference between such a Shapley value and the linear model from Google Analytics is that in the latter the value is split equally among each of the interactions on the path, while the Shapley value splits it equally among the channels. This means that if you analyze only paths leading to conversions, using the Shapley value won’t add much more to the analysis than standard heuristic models.
The Shapley value for the conversion rate
Things start to look more interesting when we take the conversion rate, rather than the number of conversions, as the game’s result. Each subsequent interaction should increase the probability of conversion, so in theory, the longer the path, the higher the conversion rate of users who were exposed to a given combination of marketing activities.
Such calculations require information not only about the paths that led to conversions, but also about interactions on non-converting paths. Such data can’t be pulled as a standard Google Analytics report. Ways to solve this problem:
- Data on users who interacted with specific channels can be obtained using advanced user segments (conditions and sequences);
- A solution may be to use an alternative interaction tracking system, such as Campaign Manager (Google Marketing Platform), which allows comprehensive interaction tracking, including impressions, without worrying about exceeding limits (which can happen in Google Analytics).
Here is our example data supplemented with information about the number of clicks and conversions on all paths:
| Path | Conv. rate | Clicks | Conversions |
|---|---|---|---|
| FB | 2% | 10 000 | 200 |
| G | 5% | 2000 | 100 |
| Aff | 0.2% | 50 000 | 100 |
| FB, G | 6% | 2000 | 120 |
| FB, Aff | 2.5% | 4000 | 100 |
| G, Aff | 6% | 1000 | 60 |
| FB, G, Aff | 8% | 500 | 40 |
| TOTAL | 720 |
For further calculations we will primarily need the conversion rate. Let’s now calculate the Shapley value for Facebook. To do this — just like in the earlier examples — we determine the path combinations containing Facebook (FB) and determine Facebook’s marginal contribution to the conversion rates on each of these paths.
Then we do the calculations according to the Shapley value formula:

We perform analogous calculations for Google (G):

Since we know that the total conversion rate for all three channels is 8%, we no longer have to compute the Shapley value formula for Affiliate. We’ll simply subtract Facebook’s and Google’s shares from the total result:
Sh(Aff) = 8% – Sh(FB) – Sh(G) = 8% – 1.88% – 5.13% = 0.98%
So we already have the Shapley values calculated for these sources in the situation where three channels appear on the path. In turn, for paths with only one channel, the solution is trivial — their share is equal to itself:

Now we have to perform the same calculations for two-channel combinations. So let’s calculate the Shapley value for Facebook in the Facebook + Google combination:

Google’s share will be the difference between the conversion rate of the Facebook + Google combination (6%) and the Shapley value for Facebook (1.5%):
Sh(G) = 6% – Sh(FB) = 6% – 1.5% = 4.5%
Analogous calculations make it possible to compute all the Shapley values for the individual combinations, and then calculate the conversions we attribute to the individual channels (number of conversions = number of clicks × conversion rate):

Naturally, the value of conversions attributed to the individual sources in every attribution model must sum to the total number of all conversions (in this case 720).
Compared with the model based on the Shapley value for the number of conversions linear model, the model based on the Shapley value for the conversion rate showed significant differences:

Conversions shifted from the Affiliate channel to Google, which is the result of rewarding channels with a higher conversion rate — typical for this implementation of the Shapley value.
Properties of the Shapley value
Let’s return for a moment to the definition of the Shapley value. We already know how to calculate it, but why is the formula the way it is? Its creator, Nobel Prize winner Lloyd Shapley, showed that it is the only formula for dividing the profit among players that satisfies the following properties:
The sum of the players’ payoffs equals the total result. From the perspective of attribution modeling, this is the fundamental condition: conversions attributed to individual channels must sum to the total number of all recorded conversions.
Symmetry. Players who, from the result’s point of view, play exactly the same role in the game will have identical Shapley values. This is an intuitive requirement we place on attribution models (we already used this and the previous property in our calculations).
Zero value of a null player. A player who contributes nothing to any combination of players will have a Shapley value of zero. Channels that contribute nothing will not be assigned any conversions.
Additivity. Regardless of how we define the result of a given game, i.e. for any characteristic functions result 1 and result 2, for every player i:
Sh(result 1, i) + Sh(result 2, i) = Sh(result 1 + result 2, i)
Example. Suppose we have several types of conversion: a transaction, a newsletter subscription and an e-book download. Additivity means that the sum of the Shapley values for the individual conversion types will be the Shapley value for the conversions counted jointly. So if
conversions = transactions + downloads + subscriptions
then for every channel i:
Sh(conversions, i) = Sh(transactions, i) + Sh(downloads, i) + Sh(subscriptions, i)
This is a necessary condition for the value of transactions, subscriptions and downloads attributed to a given channel to sum to the value of conversions attributed to that channel when segmenting into individual conversion types.
Since the Shapley value is the only function that satisfies this principle, we should in principle conclude that it constitutes the perfect attribution model. Unfortunately, it also has limitations. One of the most frequently raised objections is that it ignores the order of interactions. The paths Facebook > Google and Google > Facebook or Google > Facebook > Google > Facebook > Google are summed into the combination Facebook + Google. So at the very beginning of data processing, we blur information that intuitively seems important from the analysis point of view.
Moreover, the computational complexity of the Shapley value grows exponentially (2n) with the number of channels taking part in the conversion process, which makes calculating it for a higher granularity of channels considerably harder.
The removal effect
One of the intuitive measures used in attribution modeling is the so-called removal effect, i.e. the marginal contribution of a given channel to all conversions. It answers a simple question: how many conversions will we lose if we drop a given ad. Knowing the removal effect, we can easily translate it into a decision about how much it’s worth investing in a given ad to win those conversions back.
The measure seems simple, but it has a certain flaw. Removal effects usually do not sum to the total effect. It may happen that by switching off search ads you lose 80% of conversions, and by switching off Facebook you’ll have 30% fewer.
Remarketing can increase the number of conversions by 1/3 (its removal effect will be 25%). Added together, this comes to more than 100%. Allocating budget on this basis, we would assign more than we have at our disposal.
Therefore, to satisfy the fundamental property of attribution, removal effects are normalized so that they add up to 100%.
| Channel | Total conversions | Conversions without the channel | Removal effect | Removal effect (normalized) |
|---|---|---|---|---|
| 1000 | 200 | 80% | 53.33% | |
| 1000 | 700 | 30% | 20% | |
| YouTube | 1000 | 850 | 15% | 10% |
| Remarketing | 1000 | 750 | 25% | 16.66% |
| TOTAL | 150% | 100% |
Attribution based on the normalized removal effect is simple — we assign a given channel the percentage of all conversions that results from its removal effect. Normalization seems a sensible solution to the problem (when there’s not enough budget, it gets reduced proportionally).
Unfortunately, normalization means that single-channel paths (those with only one interaction) will be assigned fewer conversions than they actually took part in. If no other interactions took part in the conversion, why are we sharing the conversion credit with them? That makes no sense.
The Shapley value does not have this shortcoming.
Despite this obvious imperfection, the removal effect is used e.g. in attribution modeling with Markov chains. It is computationally uncomplicated and easy to interpret directly, which is why we will also use it in further examples.
It will be a value calculated from the conversion rates on paths, not a value measured empirically (you can read about the fact that these are two different things and how much they can differ e.g. in the article on the conversion lift experiment).
The Shapley value in practice
Algorithmic models were introduced in the hope that, based on the analysis of conversion paths, they would be able to read the importance of a given channel in generating conversions — including, among other things, predicting the removal effect of a given channel.
The Shapley value analyzes existing paths by simulating the removal of a given channel. The other channels cooperating with it remain, but they now operate with a conversion rate equal to that of other such paths.
This is easy to understand with a simple example. Suppose we have two sources, Facebook and Google:
| Source combination | Clicks | Conversions | Conv. rate |
|---|---|---|---|
| 1000 | 50 | 5% | |
| 2000 | 60 | 3% | |
| Facebook + Google | 500 | 30 | 6% |
| TOTAL | 3500 | 140 | 4% |
A simulation of removing Google will look like this: the clicks from the Facebook + Google path remain, but their conversion rate becomes the same as for Facebook alone:
| Source combination | Clicks | Conversions | Conv. rate |
|---|---|---|---|
| Google [removed] | 0 | 0 | – |
| 2000 | 60 | 3% | |
| Facebook [potentially with Google] | 500 | 15 | 3% |
| TOTAL | 2500 | 75 | 3% |
Click spam
The property of the Shapley value described above means that it detects click spam very well — worthless, random interactions that can randomly appear on the conversion path (more on this in the article on fraud in performance marketing).
Click spam on its own generates no conversions, and if it finds its way onto a path, it doesn’t increase the conversion rate:
| Path | Click | Conv. | Conv. rate |
|---|---|---|---|
| 10 000 | 300 | 3.00% | |
| 5 000 | 250 | 5.00% | |
| Spam | 20 000 | 0 | 0.00% |
| Facebook, Google | 2 000 | 120 | 6.00% |
| Facebook, Spam | 2 000 | 600 | 3.00% |
| Google, Spam | 15 000 | 750 | 5.00% |
| Facebook, Google, Spam | 10 000 | 600 | 6.00% |
| Total | 82 000 | 2 620 |
The Shapley value for click spam will be zero, although practically all other models will assign spam some value, even though its removal effect is zero.
| Shapley Value | Linear | Normalised Removal | |
|---|---|---|---|
| 1 140 | 860 | 1 122.86 | |
| 1 480 | 885 | 1 497.14 | |
| Spam | – | 875 | – |
| TOTAL | 2 620 | 2 620 | 2 620 |
This is one of the most valuable properties of the Shapley value.
In practice, click spam will generate some conversions, but the conversion rate will be very low.
| Path | Click | Conv. | Conv. rate |
|---|---|---|---|
| 10 000 | 300 | 3.00% | |
| 5 000 | 250 | 5.00% | |
| Spam | 20 000 | 15 | 0.08% |
| Facebook, Google | 2 000 | 120 | 6.00% |
| Facebook, Spam | 20 000 | 600 | 3.00% |
| Google, Spam | 15 000 | 750 | 5.00% |
| Facebook, Google, Spam | 10 000 | 600 | 6.00% |
| Total | 82 000 | 2 635 |
The Shapley value will then assign it the conversions that were on its own path and a certain share of conversions on other paths (it will be small due to click spam’s low conversion rate) — even though the spam won’t be increasing conversions on other paths.
| Shapley Value | Linear | Normalised Removal | Absolute Removal | |
|---|---|---|---|---|
| 1 131.25 | 860 | 1 117.96 | 1 005 | |
| 1 473.13 | 885 | 1 500.35 | 1 348.75 | |
| Spam | 30.63 | 890 | 16.69 | 15 |
| TOTAL | 2 635 | 2 635 | 2 635 | 2368.75 |
In reality, spam generates no conversions. If it appears on some path as the only interaction, it’s only because we don’t see all the interactions on the paths. For example, someone may have visited the site after seeing a TV ad. Such an interaction with the TV ad won’t be visible on the path, and thanks to that, click spam will take the credit for that conversion.
The solution to this problem is modifying the input data and adding the invisible interactions to the existing paths. If a TV ad path appears on them, click spam will once again not generate conversions on its own, and its Shapley value will drop to zero.
Remarketing
Let’s now see how the Shapley value behaves in the case of remarketing, which on its own generates no conversions but increases the conversion rate of the other paths by 20%:
| Path | Click | Conv. | Conv. rate |
|---|---|---|---|
| 10 000 | 300 | 3.00% | |
| 5 000 | 250 | 5.00% | |
| Remarketing | 0 | 0 | 0.00% |
| Facebook, Google | 2 000 | 120 | 6.00% |
| Facebook, Remarketing | 20 000 | 720 | 3.60% |
| Google, Remarketing | 15 000 | 900 | 6.00% |
| Facebook, Google, Remarketing | 5 000 | 360 | 7.20% |
| Total | 57 000 | 2 650 |
As we can see, the Shapley value for remarketing turned out to be half its removal effect:
| Shapley Value | Linear | Removal Effect | |
|---|---|---|---|
| 1 108.33 | 840 | 1 033.69 | |
| 1 373.33 | 880 | 1 306.21 | |
| Remarketing | 168.33 | 930 | 310.11 |
| TOTAL | 2 650 | 2 650 | 2 650 |
Such a distribution model doesn’t seem right. Since remarketing increased the conversion rates by 20% on the paths it took part in, it should receive a corresponding share of the conversions from those paths. The Shapley value “punishes” remarketing for its low conversion rate (which will be very low once we start counting impressions as interactions) and for the fact that it generates no conversions on its own.
Let’s see how the Shapley values would change if remarketing accidentally generated a single stand-alone conversion (a data imperfection resulting from the conversion window or the lack of full cross-device tracking):
| Path | Click | Conv. | Conv. rate |
|---|---|---|---|
| 10 000 | 300 | 3.00% | |
| 5 000 | 250 | 5.00% | |
| Remarketing | 100 | 1 | 1.00% |
| Facebook, Google | 2 000 | 120 | 6.00% |
| Facebook, Remarketing | 20 000 | 720 | 3.60% |
| Google, Remarketing | 15 000 | 900 | 6.00% |
| Facebook, Google, Remarketing | 5 000 | 360 | 7.20% |
| Total | 57 100 | 2 651 |
That single conversion doubled (!) the Shapley value for remarketing.
| Shapley Value | Linear | Removal Effect | |
|---|---|---|---|
| 1 000 | 840 | 965.56 | |
| 1 290 | 880 | 1 330.33 | |
| Remarketing | 361 | 931 | 355.11 |
| TOTAL | 2 651 | 2 651 | 2 651 |
Let’s also see what would happen if remarketing’s conversion rate turned out to be high in those few stand-alone interactions:
| Path | Click | Conv. | Conv. rate |
|---|---|---|---|
| 10 000 | 300 | 3.00% | |
| 5 000 | 250 | 5.00% | |
| Remarketing | 10 | 1 | 10.00% |
| Facebook, Google | 2 000 | 120 | 6.00% |
| Facebook, Remarketing | 20 000 | 720 | 3.60% |
| Google, Remarketing | 15 000 | 900 | 6.00% |
| Facebook, Google, Remarketing | 5 000 | 360 | 7.20% |
| Total | 57 010 | 2 651 |
In this situation, the Shapley value would assign most of the conversions to remarketing:
| Shapley Value | Linear | Removal Effect | |
|---|---|---|---|
| 25 | 840 | 3 513.84 | |
| 540 | 880 | 429.47 | |
| Remarketing | 2 086 | 931 | (1 292.31) |
| TOTAL | 2 651 | 2 651 | 2 651 |
The Shapley-value-based attribution decided that since remarketing has such a high conversion rate on its own, the other sources have a small share in the conversions generated jointly with remarketing. You can’t see it directly from the tables, but Facebook received a negative share on the Facebook + remarketing paths (Facebook got -1.7%, and remarketing +5.3%, which sums to the total result of 3.6%).
The removal effect (based on conversion rates, not an empirical study like conversion lift) gave even more absurd results, which was caused by negative values assigned to Facebook and Google, which after normalization look as above (they don’t lend themselves to any interpretation).
Why does this happen? The Shapley value looks primarily at conversion rates, so if the data contains random readings that have little to do with reality (e.g. 2 clicks, 1 conversion, a 50% conversion rate), the subsequent calculations will be burdened with serious errors. That’s why data of low statistical significance should not be included, because its random readings can completely destroy the result.
Moreover, the Shapley value averages the marginal contributions made to the individual combinations, so remarketing, which generates nothing on its own, will be treated as handicapped compared to other sources that are also able to generate conversions on their own. Budget decisions made on the basis of such calculations will presumably be unfair to remarketing.
Conversion hijacking
Finally, let’s see how the Shapley value reacts to a conversion hijacking situation. These are interactions artificially injected into the conversion path just before the transaction, such as brand bidding or discount coupons searched for after reaching the shopping cart (more on this in the article on fraud in performance marketing).
An example of perfect hijacking would be treating the click on the “pay” button in the shopping cart as an interaction (touchpoint) — everyone who completed a transaction would have had contact with it, and its conversion rate would be extremely high.
Hijacking is characterized by the fact that all the paths on which it appears have a very high conversion rate, because these are people who are about to make a transaction. On its own, hijacking generates no conversions:
| Path | Click | Conv. | Conv. rate |
|---|---|---|---|
| 10 000 | 300 | 3% | |
| 5 000 | 250 | 5% | |
| Hijack | 0 | 0 | 0% |
| Facebook, Google | 2 000 | 120 | 6% |
| Facebook, Hijack | 1 000 | 100 | 10% |
| Google, Hijack | 500 | 50 | 10% |
| Facebook, Google, Hijack | 200 | 20 | 10% |
| Total | 18 700 | 840 |
Hijacking is usually the last interaction before the transaction, so in the situation above it would get 170 conversions in the last click model. The Shapley value didn’t give it that much, which stems from the fact that hijacking doesn’t generate conversions on its own, which greatly lowers its score. Nevertheless, it was still assigned many conversions:
| Shapley Value | Linear | Removal Effect | |
|---|---|---|---|
| 410.67 | 416.67 | 399.55 | |
| 375.17 | 341.67 | 342.47 | |
| Hijack | 54.17 | 81.67 | 97.98 |
| TOTAL | 840 | 840 | 840 |
Let’s see what would happen if here, too, a single stand-alone conversion from the hijacking source appeared:
| Path | Click | Conv. | Conv. rate |
|---|---|---|---|
| 10 000 | 300 | 3% | |
| 5 000 | 250 | 5% | |
| Hijack | 10 | 1 | 10% |
| Facebook, Google | 2 000 | 120 | 6% |
| Facebook, Hijack | 1 000 | 100 | 10% |
| Google, Hijack | 500 | 50 | 10% |
| Facebook, Google, Hijack | 200 | 20 | 10% |
| Total | 18 710 | 841 |
In such a situation, the Shapley value would more than double:
| Shapley Value | Linear | Removal Effect | Absolute Removal | |
|---|---|---|---|---|
| 357.33 | 416.67 | 366.65 | 320.00 | |
| 346.83 | 341.67 | 355.19 | 310.00 | |
| Hijack | 136.83 | 82.67 | 119.16 | 104.00 |
| TOTAL | 841 | 841 | 841 | 734 |
The Shapley value reacted strongly to hijacking’s observed ability to generate conversions on its own (even though it was just one), as well as to its high conversion rate, which in this case is higher than that of the other sources operating alone. As a result, out of the 170 conversions in which hijacking appeared, it was assigned as much as a 136.83-conversion share.
Shapley value calculator
A spreadsheet for calculating the Shapley value for up to 4 channels is available for download.
Shapley values for 4 channels (.xlsx file)
Summary
The most important conclusions from the considerations above:
- The Shapley value is a kind of averaging of the contributions that a given channel makes to the result achieved by each of the channel combinations.
- For a result defined as the number of conversions, where only converting paths are taken into account, the Shapley value is equivalent to the linear model.
- To calculate the Shapley value for the conversion rate, data on non-converting paths is also needed.
- The Shapley value does not take into account the order in which channels appear on the path at all.
- The calculations are not difficult in principle, but they have to be performed for all channel combinations, which means the computational complexity grows exponentially (2n), so computing it for a large number of channels can heavily strain even a very powerful computer.
- Shapley value calculations primarily take conversion rates into account, so this measure rewards channels with higher conversion rates and strongly cuts down those that don’t generate conversions on their own (such as remarketing).
- The Shapley value detects click spam very well, as a channel that contributes nothing to the conversion rate of any path. It also correctly interprets single-channel paths (it doesn’t share the conversions they generate with other channels).
- The Shapley value is very sensitive to random values of low statistical significance, which it treats on a par with reliable data. Therefore, only data with a sufficient conversion volume, for which the conversion rate reading carries a small statistical error, should be used to calculate it.
- Combined with the fact that calculations for a large number of channels will be very resource-intensive, we can conclude that the Shapley value is best calculated for interactions grouped into a small number of channels, each of which contains data of adequate statistical significance.
The Shapley value is fed with data on marginal contributions calculated from the observed conversion rates on paths. It is not an empirical measurement. This is one of the reasons why it doesn’t correctly interpret the contributions made by conversion-hijacking-type interactions.
An alternative to the Shapley value are models using Markov chains.
In this article, mathematical terminology has been deliberately simplified to make it easier to understand the essence of the topic being described.
