
Previous article (part 11): Markov chains
Attribution modeling tools can help solve a number of practical analytics problems in e-commerce. When analyzing multi-channel paths, we often encounter channels interweaving with one another, where conversions involve — in various configurations — interactions with different traffic sources. Clicks from specific sources can be both the last ones on the conversion path and appear earlier on that path (we’re talking about assist clicks).
The appearance of a specific interaction on the path doesn’t always have to increase the probability of conversion. If two sources overlap, the sum of their effects can be greater than, smaller than or equal to their effects taken separately. We say that sources can reinforce each other (2+2=5) or cannibalize each other (2+2=3), or participate in influencing conversions on equal footing (2+2=4):
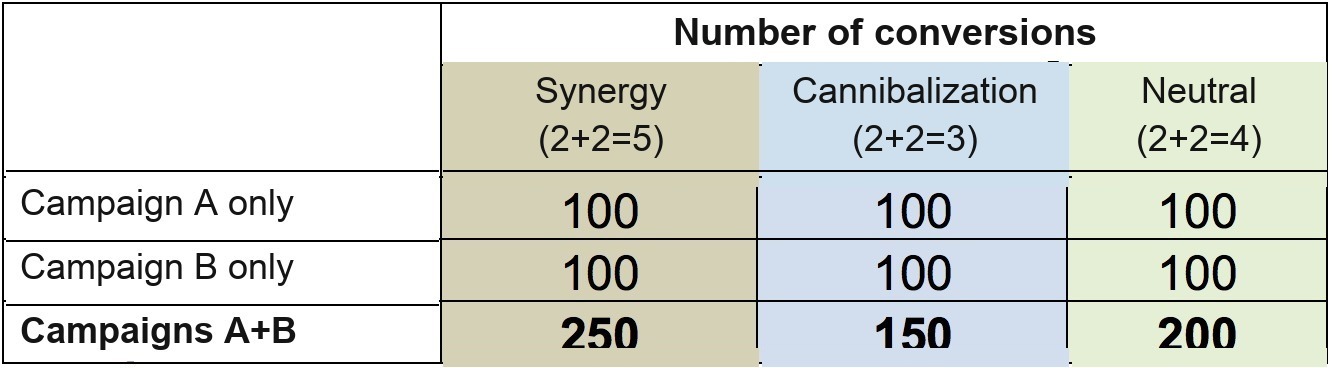
The only way to actually verify which situation we’re dealing with is testing with a control group (see the incremental remarketing effectiveness test).
Attribution modeling tools will, however, provide additional information that helps better understand the scale of channels overlapping with one another.
Who is telling the truth?
Advertising systems usually show a completely different picture of effectiveness than what we see in Analytics. Does this mean the data is wrong? No. They simply have completely different attribution models.
Each advertising system sees only “its own universe”, i.e. clicks on its own ads. Analytics has to perform attribution between overlapping sources when a user visits from several different sources before converting.
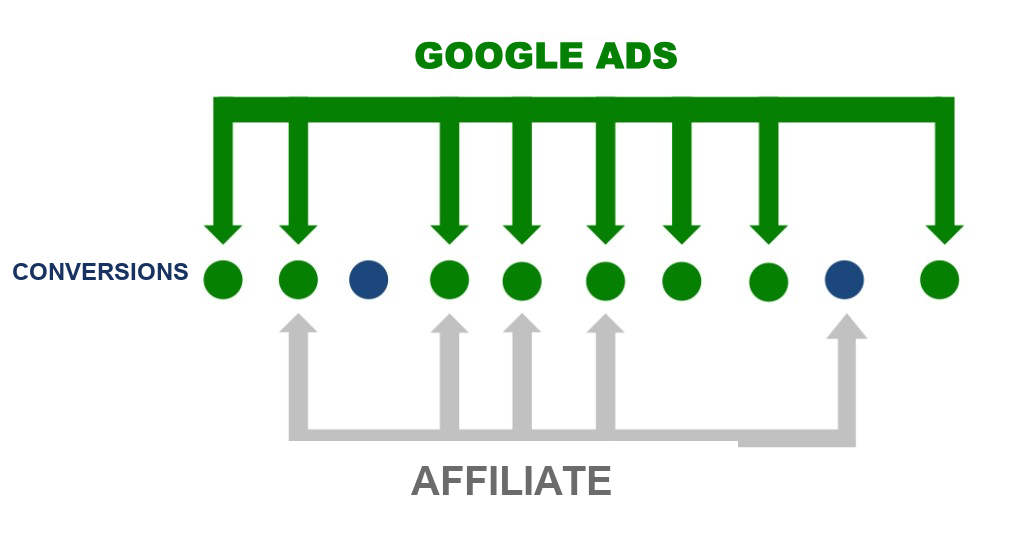
Let’s see what this looks like from the perspective of Google Ads, an affiliate system and Analytics.
From the Google Ads point of view, the situation looks like this:
And this is how the affiliate system sees it:
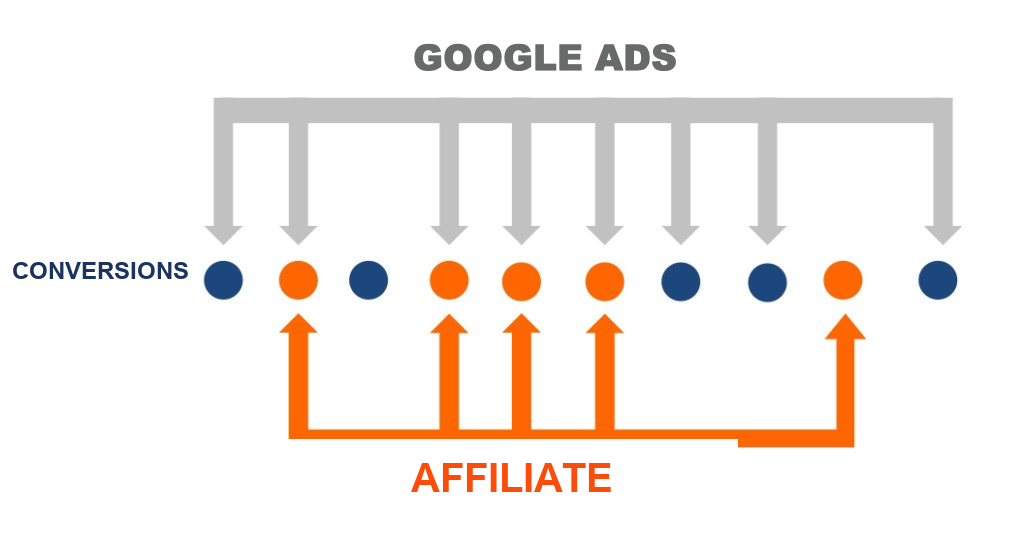
For each of these conversion tracking systems, the other sources “don’t exist”. These systems do report “last click” conversions, but only as long as it’s a click coming from the given system. As a result, both sources lay claim to a large share of the conversions:
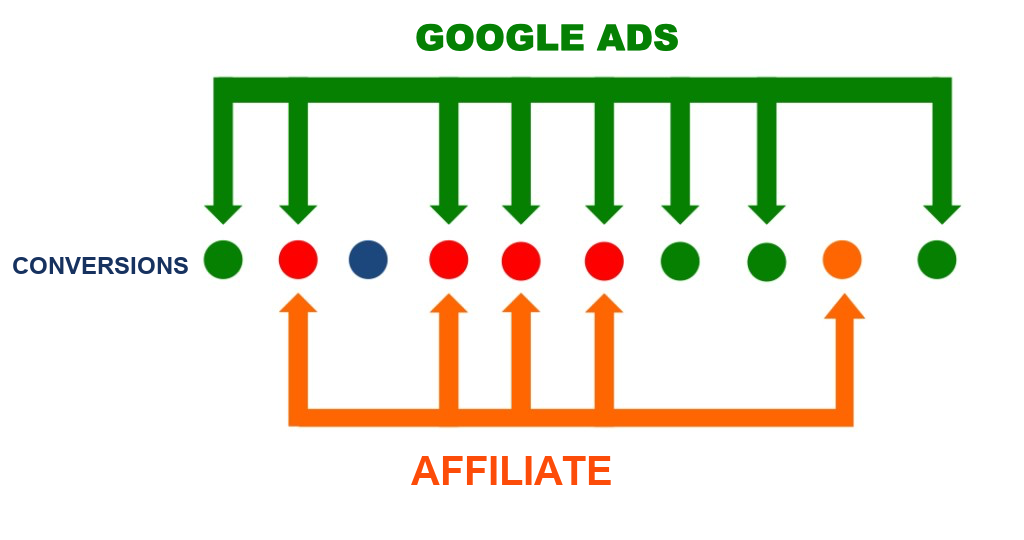
So we can see that a large share of conversions is “shared” — the channels overlap with each other.
Channels overlapping with one another
Let’s look at a specific example. An e-commerce advertiser gets a significant share of traffic from pay-per-click (CPC) Google search advertising (Google Ads), as well as from a partner (affiliate) program billed per sale (CPA).
The advertiser knows that part of the Google Ads traffic is brand-related traffic, which makes no sense to compare with other sources. So for the purposes of the analysis, they carve out a multi-channel path group Google Ads Search Non-Brand, which contains only keywords unrelated to the brand.
In Google Analytics, the advertiser sees transaction data from individual sources:
| Session source | Sessions | Conv. rate | Transactions |
|---|---|---|---|
| Google Ads Search Non-Brand | 315521 | 0.69% | 2187 |
| Affiliate | 34137 | 0.37% | 125 |
It turns out, however, that these numbers in no way match the data reported by the agency managing Google Ads, nor the sales data reported by the affiliate program administrator, on the basis of which the CPA commission for partners is calculated. Everyone claims that the number of conversions they generated is much higher!
What is the cause of these differences? No, it’s not data loss due to sampling or other Google Analytics “errors”. The primary cause is the different attribution models used by each of the reporting systems:
- The Google Analytics traffic acquisition report assigns transactions to the last non-direct visit within the last 90 days (the default setting is used).
- The partner (affiliate) network assigns conversions to the last click on a partner’s link within 90 days before the conversion (in accordance with the affiliate program’s terms).
- In Google Ads, transactions are assigned to the last click on a Google Ads link within 90 days before the conversion (a custom setting was applied; the default is 30 days)
For the affiliate network’s conversion tracking systems and for Google Ads, it doesn’t matter that the user entered from other sources earlier or later. If even one of the interactions was a click on an affiliate link / Google Ads ad, each of these systems will “lay claim” to that conversion.
This means that in some situations both Google Ads and the affiliate program will report a given transaction as “theirs” in their systems, while in the Google Analytics report that transaction may have yet another source (e.g. Facebook).
Below you’ll find references to solutions used in Universal Analytics (the previous version of Google Analytics). Attribution currently (January 2024) works the same way in Campaign Manager 360 and Search Ads 360 (Google Marketing Platform tools).
Thanks to custom attribution models (see the article Single-touch models), we can replicate the models used by external conversion tracking systems. So let’s try to obtain reports that assign conversions the way they look from the point of view of Google Ads and the affiliate system.
To achieve this, we’ll create attribution models that assign conversions (a) to the last click on a Google Ads ad unrelated to brand search and (b) to the last affiliate click.
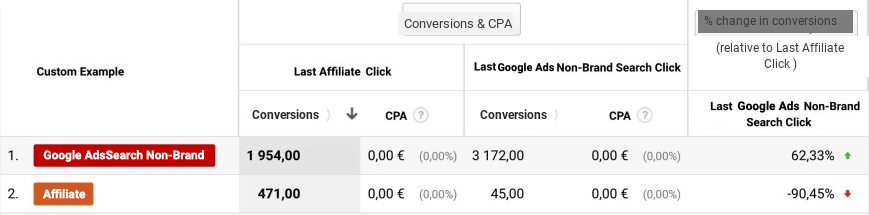
Thanks to these models we can see how many conversions had Google Ads Search Non-Brand on their path (3172) and affiliates (471).
The data of the Last Affiliate Click model should match what the affiliate system reports. Compared with the conversion reports in the Google Ads panel, the Last Google Ads Non-Brand Search Click model will show differences resulting from separating out conversions for brand keywords (related to brand search): if a click on a non-brand keyword is followed by a click on a brand keyword and a conversion, in the Last Google Ads Non-Brand Search Click attribution model it will be assigned to the non-brand keyword, while in Google Ads it will be assigned to the brand keyword that occurred directly before the conversion. Differences may also arise from the reporting time of conversions.
In the report we can see a drastic drop in conversions assigned to the Affiliate channel in the Last Google Ads Non-Brand Search Click model. Thanks to this model we can see that 90.45% of the conversions that had the Affiliate channel on their path also had the Google Ads Search Non-Brand channel on their path.
Session source and transaction source in Analytics
Google Analytics (starting with GA4) introduced separate concepts of the session source and the conversion source.
The session source is the source of the first visit during a session. Here we have last (non-direct) click attribution. If a conversion takes place within a given session, it will be assigned to that session source.
The conversion source uses the attribution model defined in the settings and takes into account all visits within the conversion window. With the last click model (paid and organic channels), this will be the last visit before the transaction.
In Google Analytics (starting with GA4), a new visit during an ongoing session does not change the session source. It remains unchanged until the session ends. Such a visit will, however, affect the conversion source.
This is described in more detail in the article on attribution in Google Analytics [GA4].
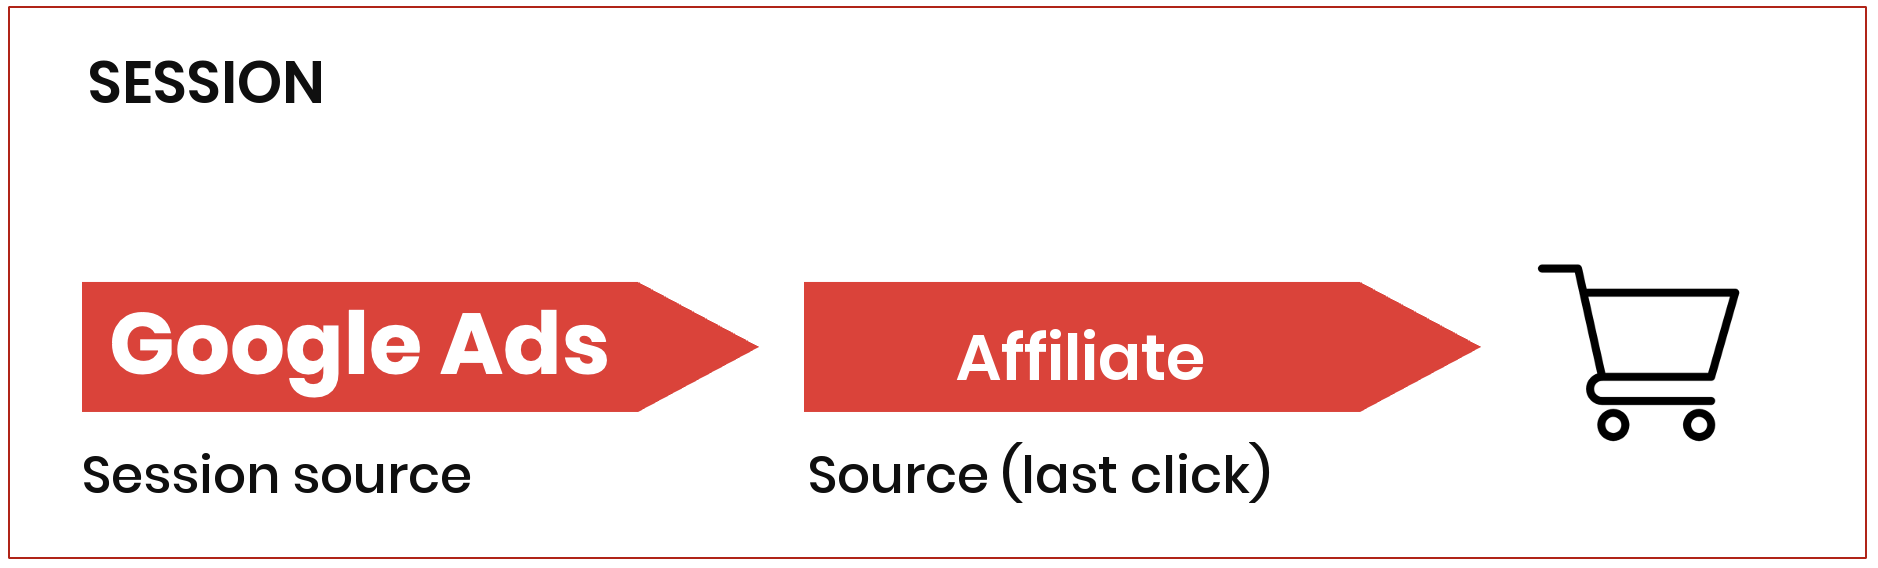
Above: The session source for this transaction will be Google Ads, but the (last click) source will be Affiliate.
Let’s then look at a comparison of two exploration reports in Analytics: session source and source, for the Cashback and Vouchers channels:

We can see there are considerable differences between these channels in the two reports. The Vouchers channel has more than 2x more assigned conversions than session sources with a conversion. This means that in half of the cases, the visit from the Vouchers channel took place during an already open session in which a conversion later occurred.
It looks like at least half of the conversions reported for this channel in the last click model came from other sources, and the entry from the Vouchers channel happened during an already existing session.
If we use the Source and Session source dimensions in a single exploration, we can see from which other sources the sessions began during which the conversions from the Cashback and Vouchers channels took place.
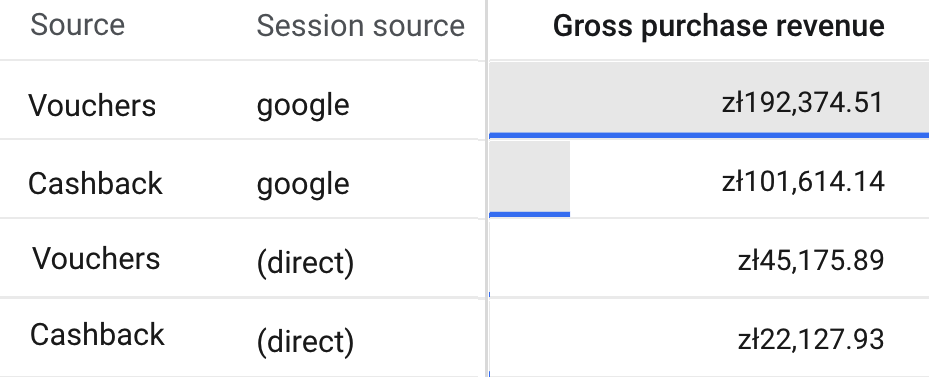
As you can see, these were most often users who visited the site directly or from Google, and who, during the ongoing session, entered the site again — this time from a Vouchers or Cashback redirect.
The likely scenario here is that users noticed the “enter discount code” box while finalizing the transaction and started searching for it online, then returned to the site with a discount coupon, counted towards the Cashback or Vouchers source (see the article Discount coupons — a great promotion or manipulation).
Using Analytics segments for attribution analysis
The attribution modeling section in Google Analytics offers relatively few options. The spectrum of models has been heavily reduced, as have the options for customizing them.
Some attribution model features can, however, be recreated — or at least approximated — using segments in explorations.
The Source > Transaction sequence
A segment of users who (across all sessions) had a visit from a given source followed by a transaction will point to all the transactions that occurred after a visit from that source.
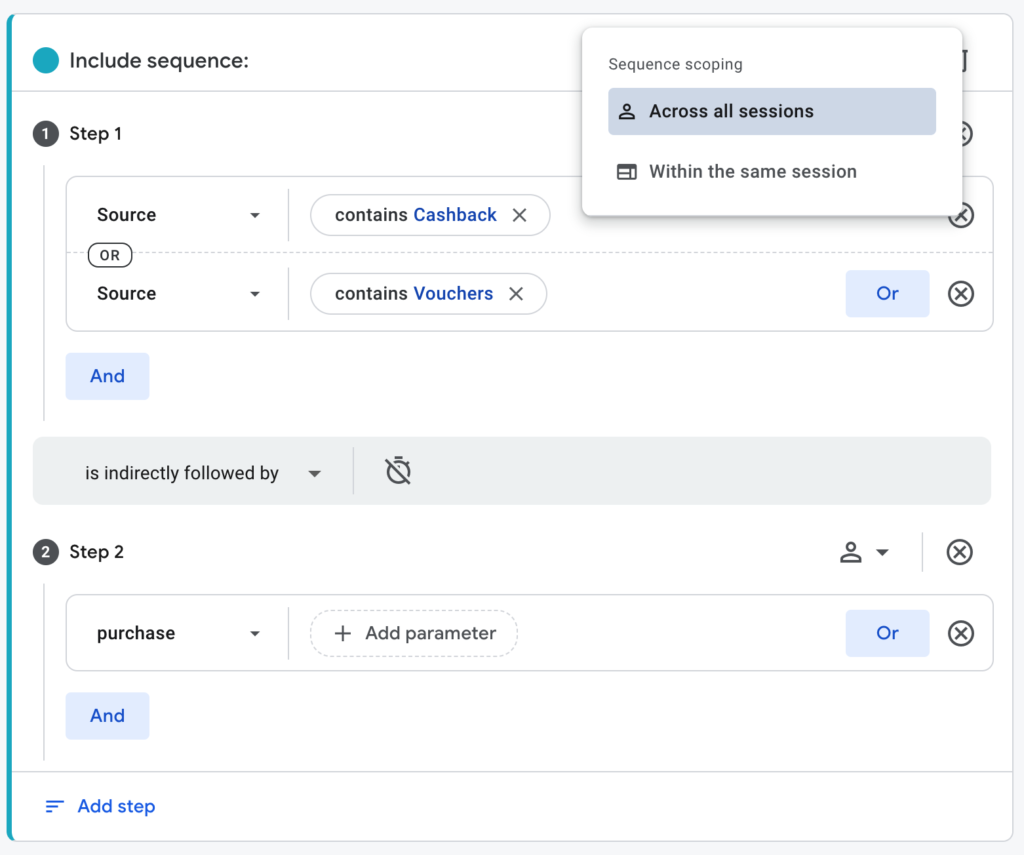
It’s important that this is a sequence, because by creating a simple source AND transaction segment we would also capture users who visited the site from the given source after completing the transaction.
So let’s create a segment of users who had a Cashback or Vouchers source before the transaction, and a segment of users who had such a session source before the transaction. In the segment overlap exploration we can see that in this view, too, we see almost twice as many sources as session sources.
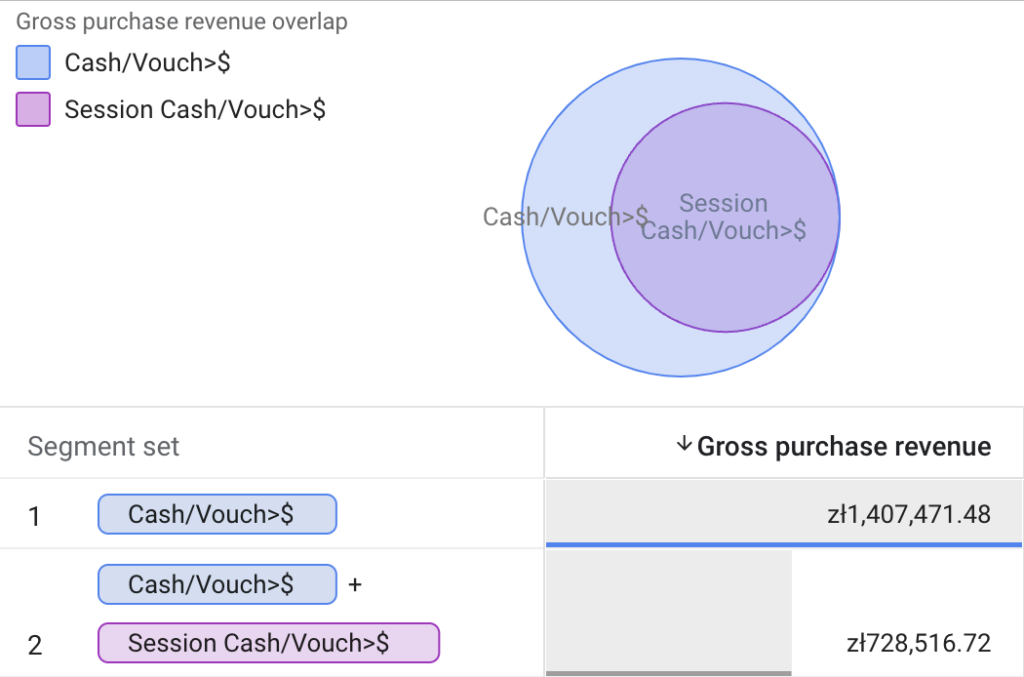
Segments like these can also be useful for identifying the revenue that occurred after a visit from a given source regardless of its place on the path. This makes it possible to reconcile Analytics reports with e.g. Facebook. Below is a comparison of
- Transactions for which facebook.com was the last source before the transaction (the service uses a last click model)
- Transactions for which facebook.com was on the conversion path (the Facebook>$ segment)
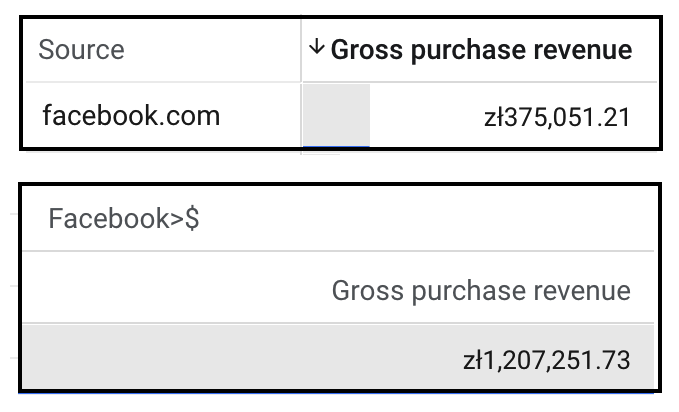
This makes it easy to show why most of the conversions reported in Facebook are not visible in Analytics reports and where they “got lost”. To a large extent, they were covered up by attribution.
When comparing Facebook reports, note that Facebook’s reports may, depending on the attribution selected there, also report post-view conversions. In turn, post-click conversions also include conversions after clicks that did not lead to a site visit (i.e. ones that Analytics won’t record as visits from Facebook) — these will also include e.g. reaction clicks (“likes”).
When using segments, remember that although they make it possible to extract similar data, they are not identical to attribution reports, especially in the context of conversion windows (see the Analytics help article on segments).
Next article (part 13): Assisted conversions
Worth reading: A guide to attribution in Google Analytics
