
One of the basic attribution analysis techniques is comparing how conversions are assigned across different attribution models. How can we carry out such an analysis, and what information can it give us?
Previous article (part 5): Direct visits and non-direct models
What is an attribution model?
An attribution model is a rule by which conversions and the related revenue are assigned to the interactions that were on the path leading to the conversion. It determines which interactions, and in what proportion, are credited with driving the conversion.
In 2024, Google Analytics introduced a terminology change and what were previously called conversions in Analytics were renamed key events. Some illustrations in this article, created earlier, may point to key events in Analytics as conversions. In this article, the use of the word “conversion” (in the general sense) will not always match Analytics terminology.
Types of attribution models
The basic division of attribution models is into:
- single-touch models, which assign 100% of a conversion’s value to one interaction that occurred on the path leading to the conversion
- multi-touch models, which distribute the value among all the interactions that occurred on the path
This doesn’t mean that in every multi-touch model each interaction always receives a share in the conversion. Some multi-touch models with more complex rules can sometimes assign some interactions a 0% share, and in an extreme case it may happen that only one interaction is assigned 100% of the value. The essence of multi-touch models is that they potentially take into account all interactions on the path, but the specific share depends on the specific model.
Attribution models are sometimes divided into heuristic ones — those with a fixed rule for calculating the share in a conversion — as opposed to algorithmic models, which can dynamically assign a share in the conversion individually for each path, based on the available data.
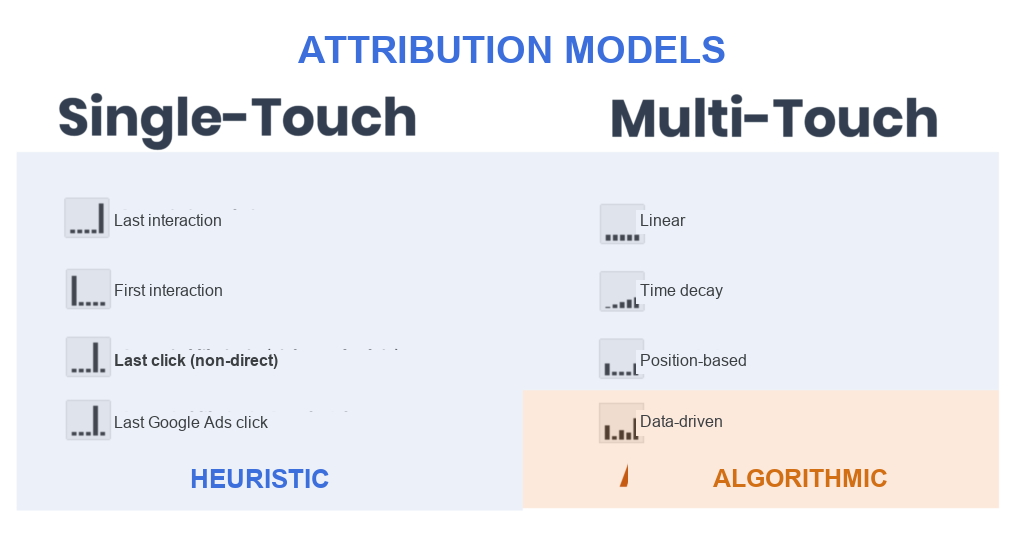
More about individual attribution models in the articles on single-touch models and multi-touch attribution.
The model comparison tool
One of the basic attribution modeling tools is model comparison. This tool’s reports show how the value assigned to a given channel/source changes depending on the model used.
Model comparison is available in, among others, Google Ads, Campaign Manager, and Google Analytics. There can be some differences between the individual systems, but the principle of operation is similar.
The Google Analytics model comparison tool is located in the Advertising section. Its operation is described in this Analytics help article. Below is a list of features worth additional comment.
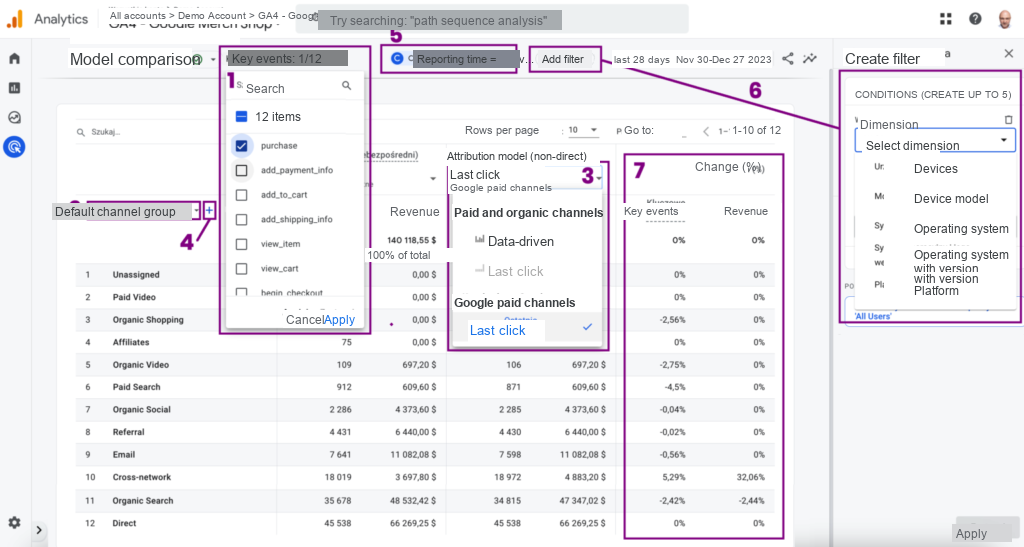
1 – Selecting the key event (formerly: conversion)
The first thing to do when working with the model comparison tool is to select the key event or set of key events we want to model. The basic key event that is most often analyzed in practice is a transaction or a lead. You can also analyze other, less important key events, e.g. add to cart.
When selecting several key events at once, or all of them, it’s worth asking yourself: what is the interpretation of this data?
Generally, selecting several key events was made possible so it can be used for a set of alternative events of the same kind, e.g. “purchase_online” and “purchase_offline”, or “lead contact page”, “lead_footer”, and “lead_landing_page” — i.e. different variants of effectively the same action. A set of “purchase” and “add_to_cart” probably won’t make much sense.
If you have all key events selected, consider whether that’s really what you mean and whether you know how to interpret this data.
2 – Selecting the traffic source dimension
Next, you need to choose in which dimensions we’ll want to carry out the attribution — whether it will be the default channel group, a custom channel group (recommended), or source / medium, etc.
3 – Selecting the models to compare
We choose the models we want to compare. As you can see, currently (January 2024) the choice in GA4 isn’t very wide.
4 – Selecting a secondary dimension
Easy to miss: there’s an option to add a secondary dimension segmenting the report. It can be useful, for instance, to separate campaigns from different sources, especially if campaign names happen not to be unique (e.g. the same campaign names in Google Ads and Microsoft Advertising (Bing)).
5 – Reporting time
Model comparison in GA4 lets you choose the reporting time (by interaction time or by the time the event occurred), which can be useful when comparing with reports from advertising systems, which usually report by interaction time. You can read more about reporting time in this article.
6 – Filters
A wide range of filters can be added to the report, e.g. mobile devices only or selected countries.
7 – The comparison result
The Change % column shows how much the picture of channel effectiveness differs between the compared attribution models — both in the volume of key events and in their value.
Conclusions from the model comparison report
The most important conclusion from a model comparison is precisely the difference in how key events are assigned to individual channels.
When the differences are small…
If the differences are small (on the order of a few percent), attribution doesn’t have much impact on evaluating the effectiveness of your activities.
This isn’t unusual. Interactions from a given channel will play different roles on paths, but these effects can cancel out — e.g. when a given channel opens a path as often as it closes it, so first-click, last-click, linear, and many other multi-touch models can show an identical result.
Example: Let’s assume that for our site there are only two paths, each generating the same number of key events (formerly: conversions): 4 key events each (8 key events in total).
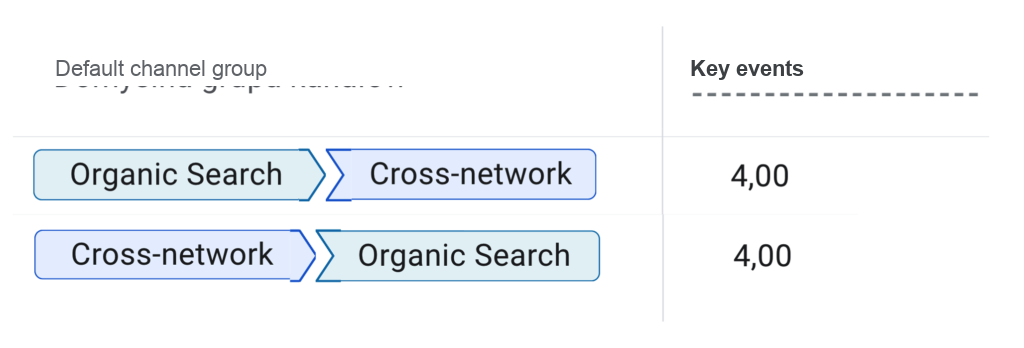
Here’s what attribution will look like for the individual models:
Last click
| Path | Organic Search | Cross- network | Total |
|---|---|---|---|
| Organic Search > Cross-network | 0 | 4 | 4 |
| Cross-network > Organic Search | 4 | 0 | 4 |
| Total | 4 | 4 | 8 |
First click
| Path | Organic Search | Cross- network | Total |
|---|---|---|---|
| Organic Search > Cross-network | 4 | 0 | 4 |
| Cross-network > Organic Search | 0 | 4 | 4 |
| Total | 4 | 4 | 8 |
Linear model
| Path | Organic Search | Cross- network | Total |
|---|---|---|---|
| Organic Search > Cross-network | 2 | 2 | 4 |
| Cross-network > Organic Search | 2 | 2 | 4 |
| Total | 4 | 4 | 8 |
Position-based model
| Path | Organic Search | Cross- network | Total |
|---|---|---|---|
| Organic Search > Cross-network | 2 | 2 | 4 |
| Cross-network > Organic Search | 2 | 2 | 4 |
| Total | 4 | 4 | 8 |
Time decay model*
| Path | Organic Search | Cross- network | Total |
|---|---|---|---|
| Organic Search > Cross-network | 1 | 3 | 4 |
| Cross-network > Organic Search | 3 | 1 | 4 |
| Total | 4 | 4 | 8 |
*) assuming both paths are symmetric in time
As you can see, in each of these models we get exactly the same result for each channel: 4 key events. See also the article — introduction to attribution modeling.
In such situations, you should try changing the analyzed dimensions to campaign, source / medium, or another custom channel group, or segment the traffic using a secondary dimension or filters. It’s possible that differences will then appear. Let’s remember, however, to look for differences that are significant both in percentage terms (2–3% is an insignificant change) and that have enough volume to draw statistically significant conclusions.
In the example from the demo account (Google Merch Shop) there’s essentially nothing interesting to see. There, the last click across paid and organic channels and last click across paid channels models are compared. We see a few-percent takeover by Cross-network (read: Performance Max) of attribution from the other channels (mainly from Organic Search). This doesn’t add much — probably some of the users who came from a Performance Max campaign return to the site by searching for the store’s name in Google and clicking the link in the organic results. What may be puzzling is the difference between the change in the number of key events and in revenue for the Cross-network channel: 5.29% vs. 32.06%.
It’s possible this is down to chance and one large transaction is responsible for the anomaly, but it may also be the result of some configuration error (the demo account is far from perfect).
Significant differences
Now let’s see what conclusions can be drawn from significant differences in attribution. Again we have a comparison of the last click across paid and organic channels and last click across paid channels models.
The first report will be closest** to the key-event values reported in the standard traffic reports (session source); the second should be close*** to Google Ads reports.
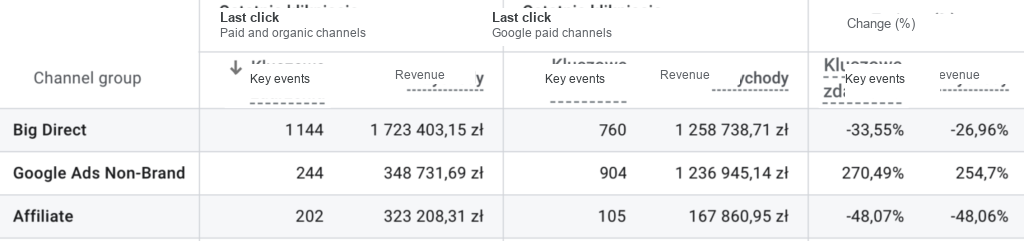
**) the differences will result from using different dimensions: session source in the acquisition report vs. source in model comparison. More on this in the article on attribution in Google Analytics.
***) Google Ads may use a different attribution model and different data modeling.
What stands out is a very strong increase in the importance of the Google Ads Non-Brand channel, mainly at the expense of Affiliate and Big Direct (you can read about Big Direct in, among others, the article on channel groupings).
So you can see that the Google ads and Affiliate paths overlap, and almost half (48.7%) of the key events from Affiliate have an earlier visit from Google Ads on the path. The actual overlap of these channels is probably greater (this comparison only includes Affiliate key events in the last-click model, and yet this channel probably also appears earlier on paths).
The conclusion about these channels overlapping can be the start of a discussion of whether, in this case, we’re dealing with mutual support or cannibalization.
Very interesting is the almost threefold increase in the Google Ads Non-Brand channel (see the article on channel groupings). There are many signs that after clicking a Google ad, users return to the site directly or by searching for it in Google and clicking the organic link or our ad. This means that the actual effectiveness of Google ads is higher than the standard last-click reports suggest. It may also explain the significant discrepancies between Google Ads and Analytics data.
If previous decisions to invest in Google advertising were made based on Analytics data, it might be worth revising the assessment of effectiveness in Google Ads and increasing investment in this channel, since it’s more profitable than it previously seemed.
In the following articles on attribution modeling you’ll find more examples of using model comparisons.
Next article (part 7): Single-touch models
Worth reading: A guide to attribution in Google Analytics
